The New Data Preparation Experience is a visual, step-by-step way to build datasets in Analytics Builder. Instead of a linear list of tables and fields, you have a workflow canvas that shows:
- Each transformation as a step
- How data flows from one step to the next
- Where you have branches (for more complex workflows)
- A real-time data preview that updates dynamically
The New Data Preparation Experience also has the following benefits:
- More transformation options, including Pivot, Unpivot, Aggregate, and Append.
- Support for advanced functionalities, such as branching workflows and composite datasets (using one dataset as the input to another).

|
Important: New datasets that were created using the New Data Preparation Experience open in the new visual workflow by default. Existing datasets that were created in the legacy experience remain in the legacy data preparation editor and cannot be converted.
|
All downstream features including visuals, dashboards, and sharing function the same in both new and legacy data preparation experiences.
Create a new dataset
You always see the New Data Preparation Experience when you create a new dataset from a data source.
Watch this video to learn how to create a new dataset from existing data sources, using the fast path, or by opening an existing dataset in Analytics Builder. Review the written steps below.
To create a new dataset:
- Navigate to Insights Portal.
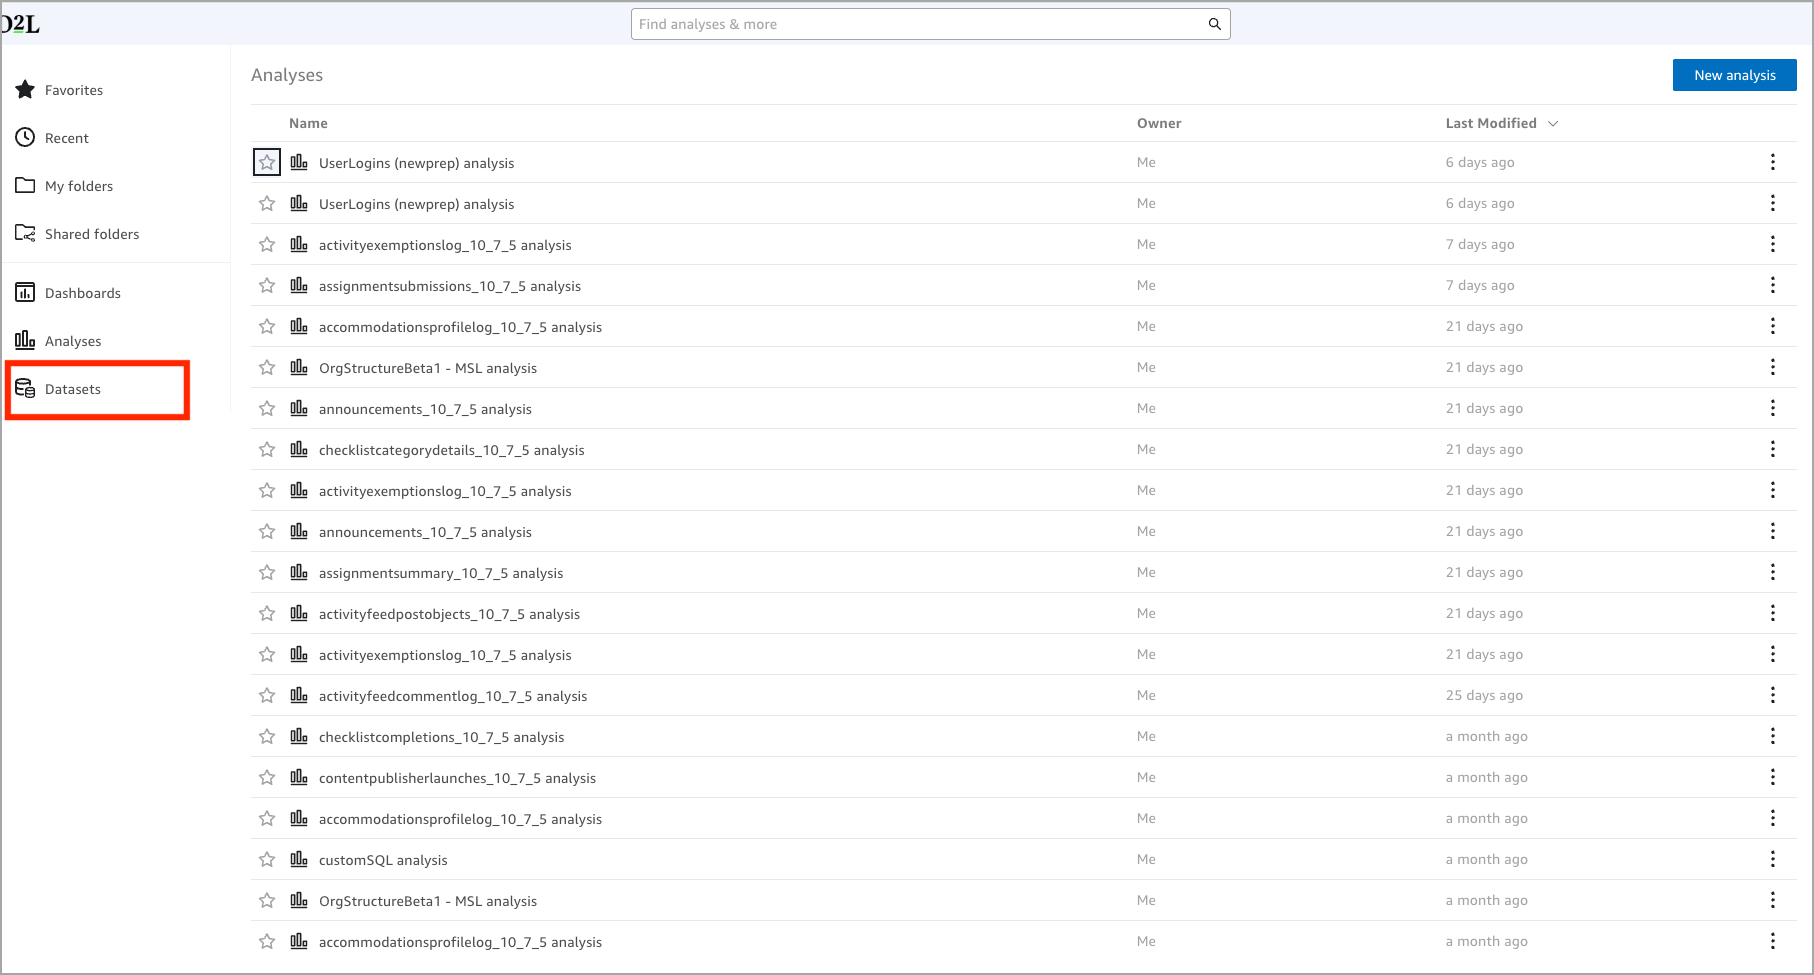
- Under the Analytics Builder tab, click Analytics Builder. Analytics Builder opens in the Analysis tab by default. From this view you can also see the Favorites, Recent, My Folder, Shared Folders, Dashboards, and Datasets tabs.
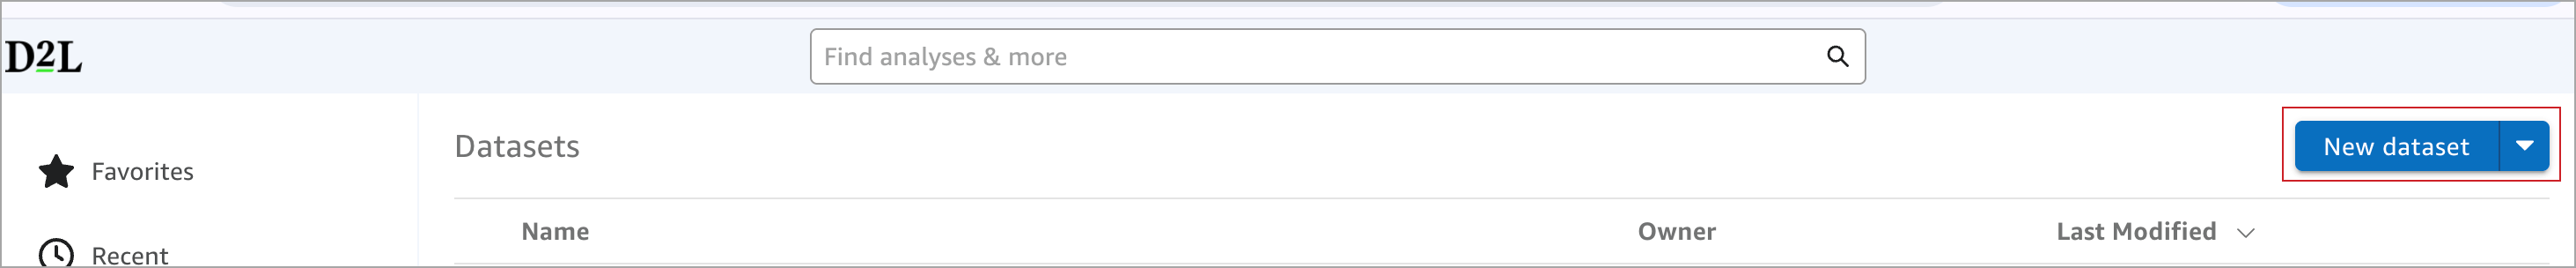
- Click the Datasets tab to show the list of available assets.
- Click New dataset to begin creating a new dataset.
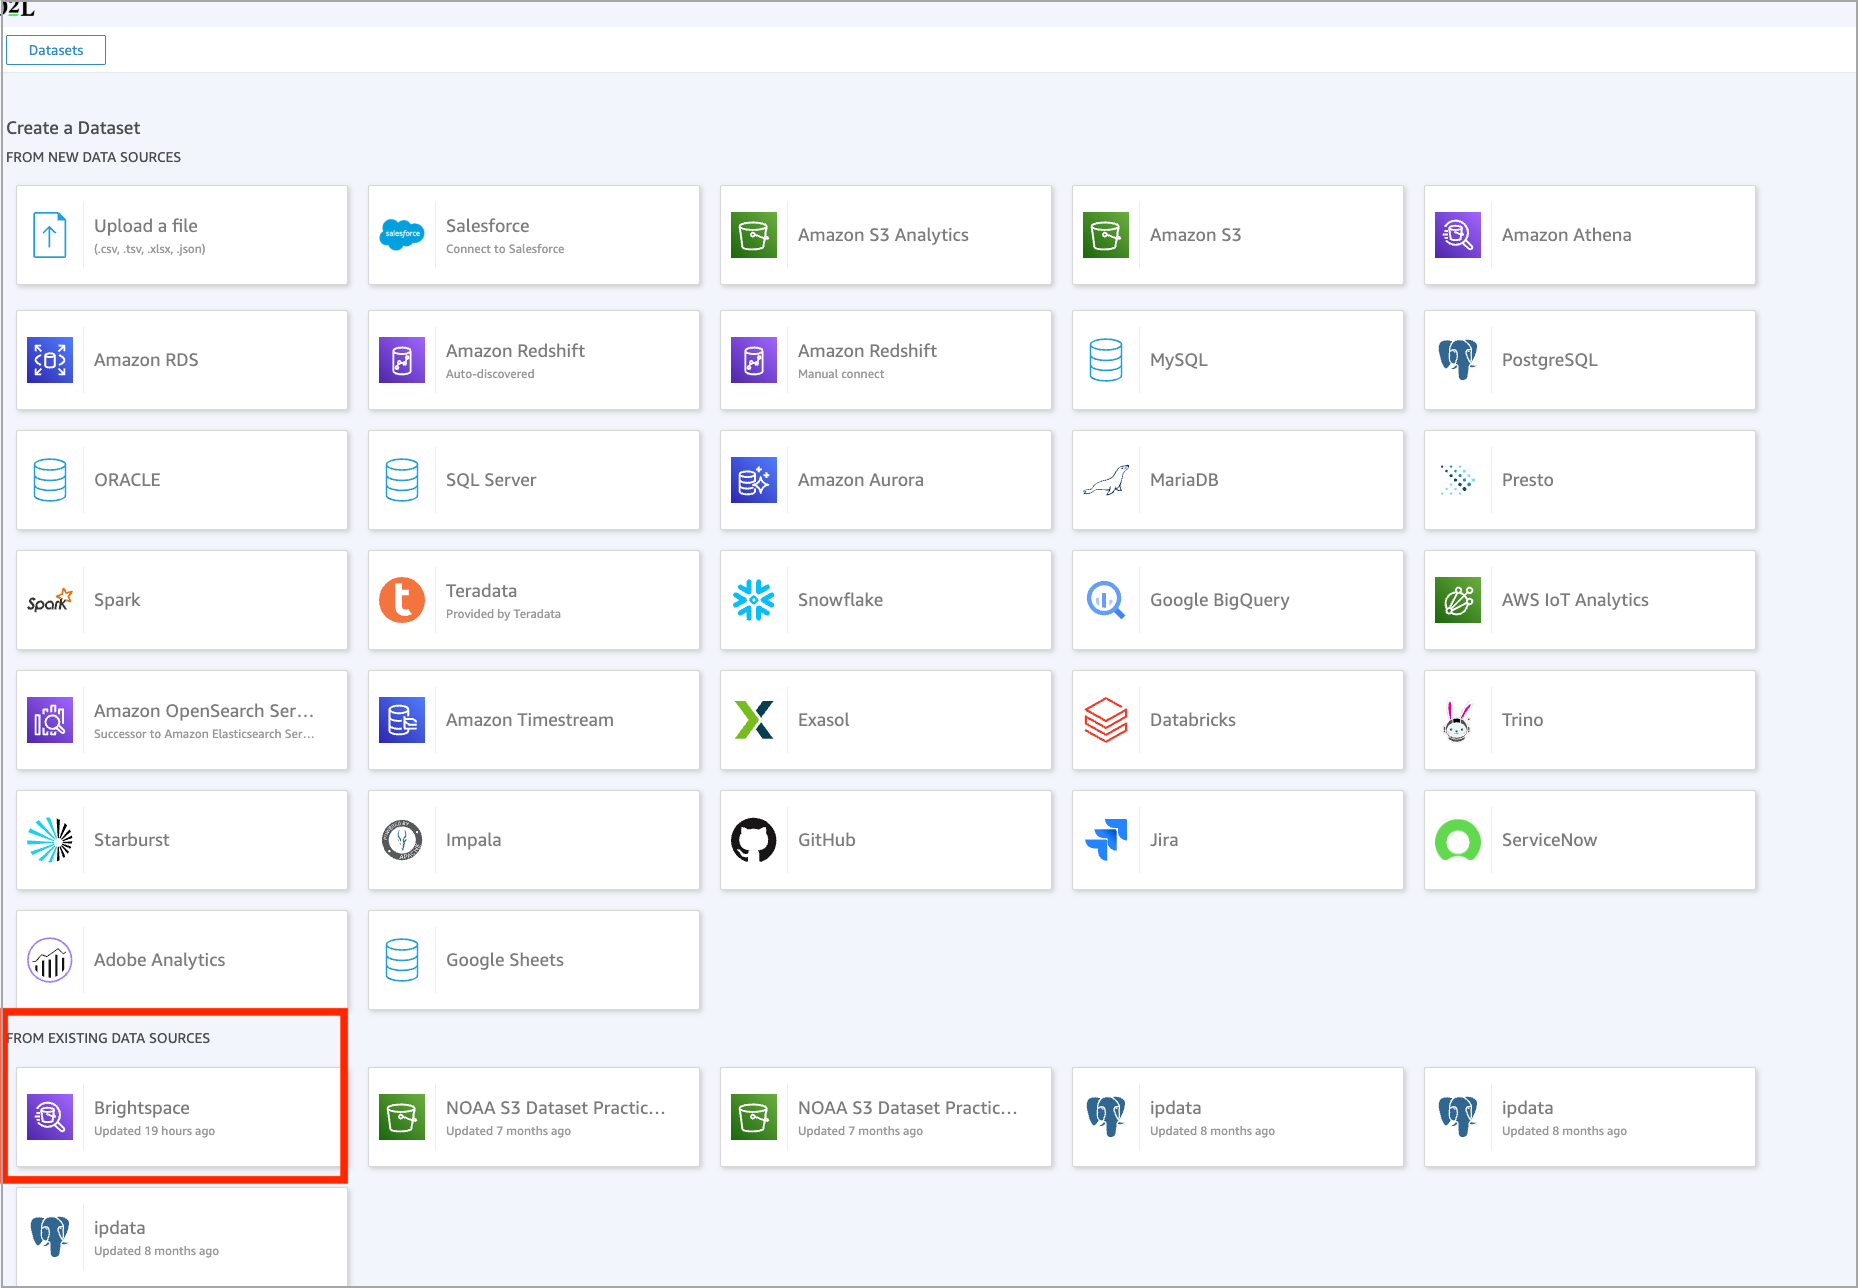
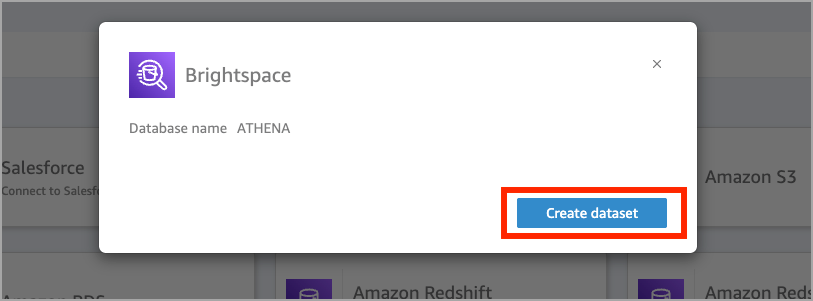
- Under FROM EXISTING DATA SOURCES, choose your source. For example, select Brightspace, then click Create dataset.
- Select the BDS you want to use and click Edit/Preview data.

This opens a New Data Preparation Experience.
Create a new dataset using custom SQL
Watch this video to learn how to create a new dataset using custom SQL in Analytics Builder. Review the written steps below.
To create a new dataset using custom SQL
- Navigate to Insights Portal.
- Under the Analytics Builder tab, click Analytics Builder. Analytics Builder opens in the Analysis tab by default. From this view you can also see the Favorites, Recent, My Folder, Shared Folders, Dashboards, and Datasets tabs.
- Click the Datasets tab to show the list of available datasets.
- Click New dataset to begin creating a new dataset.
- Under FROM EXISTING DATA SOURCES, choose your source. For example, select Brightspace, then click Create dataset.
- If you want to build using an existing BDS, you can optionally select the BDS you want to use under Tables.
- Do one of the following:
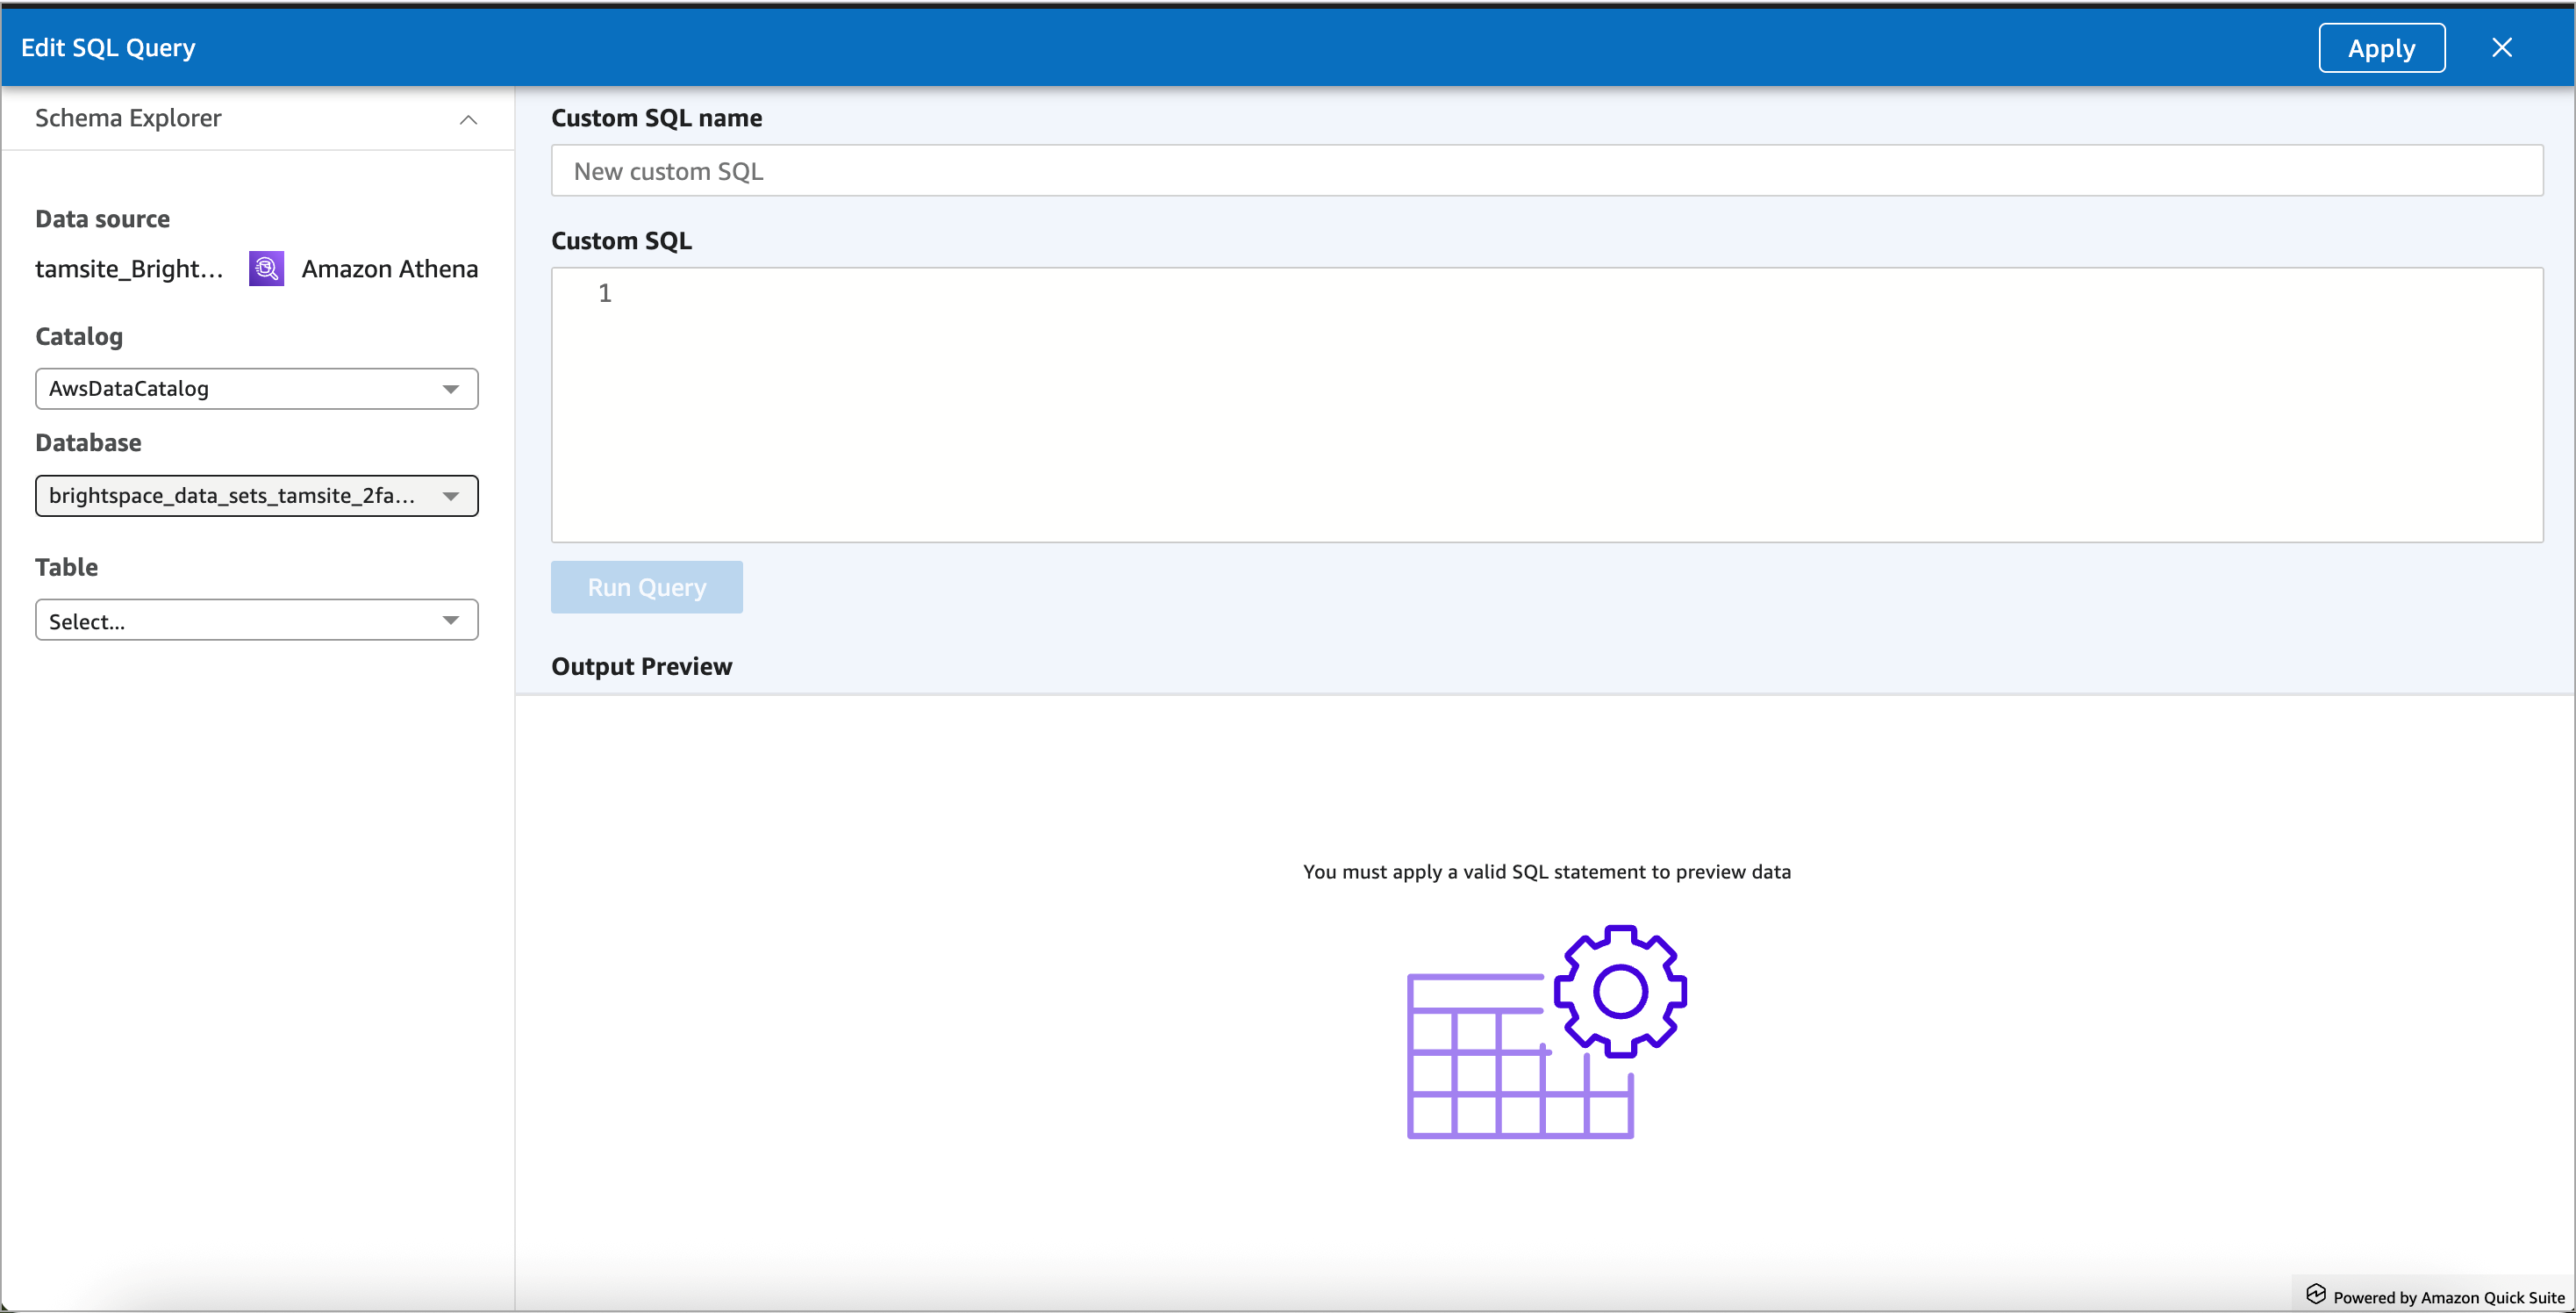
- Click Use custom SQL to begin writing your SQL query immediately.
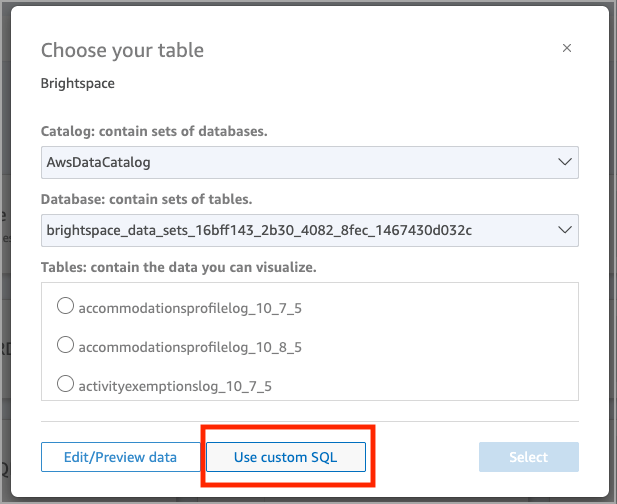
- Click Edit/Preview data to open the SQL editor in the new experience first.
Both paths open the new Data Preparation experience, where you can continue building your datasets using SQL.
Open an existing dataset
When working with datasets you have already built or that come from BDS, you can quickly open them from the Datasets tab.
To open an existing dataset
- Navigate to Insights Portal.
- Under the Analytics Builder tab, click Analytics Builder.
- Click the Datasets tab.
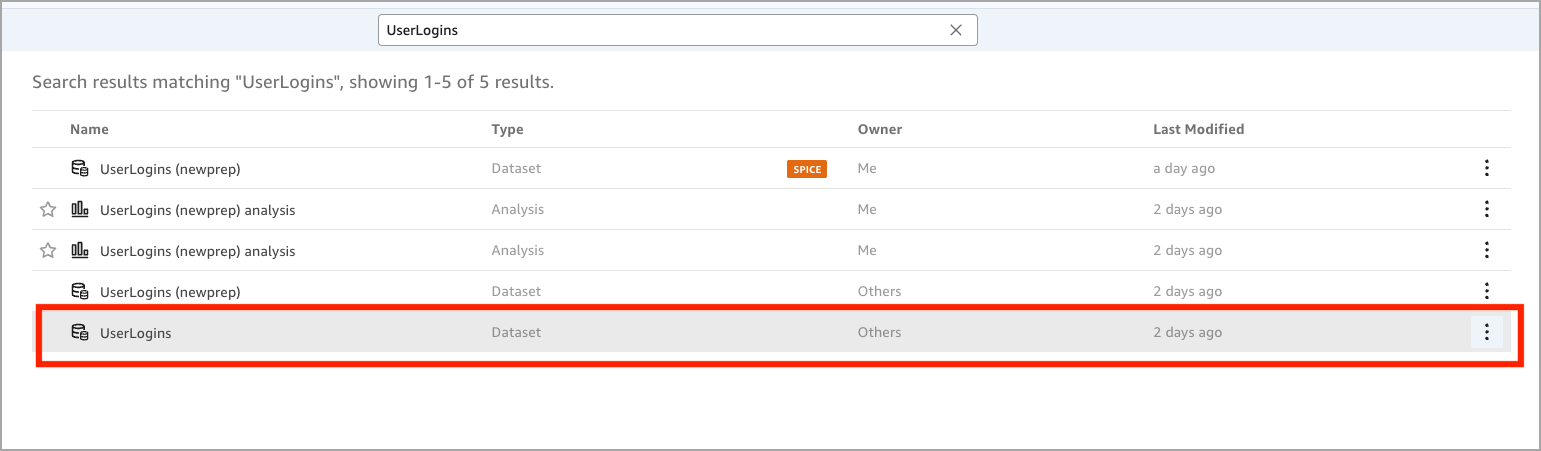
- Search for the dataset name.
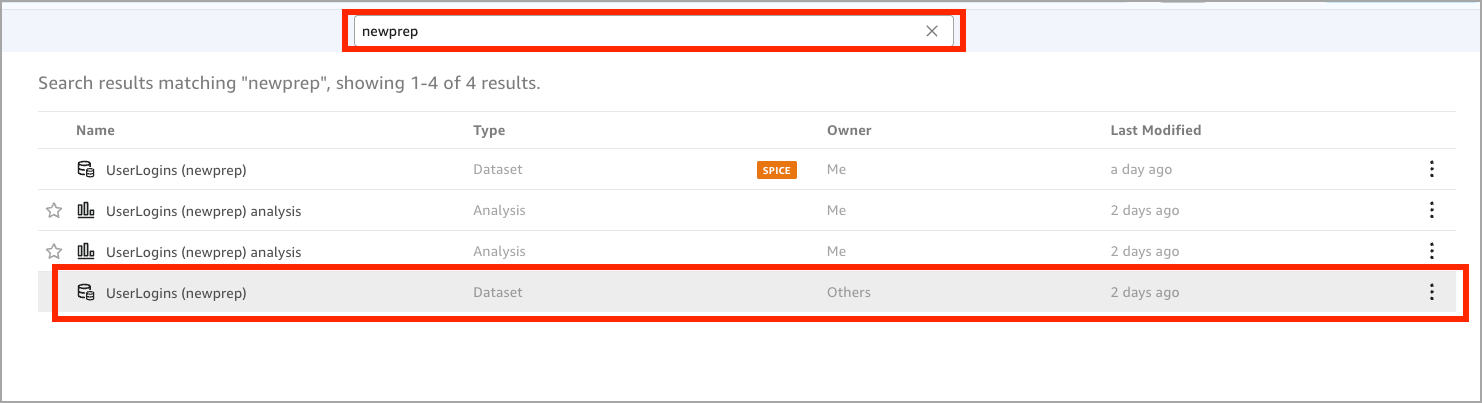
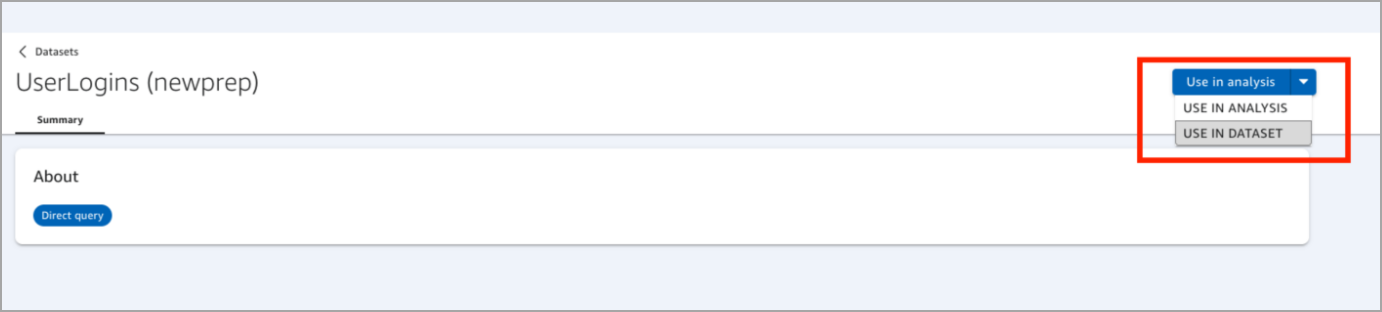
- Click Use in analysis and select USE IN DATASET.
This opens the New Data Preparation Experience.
Use Fast Path
Authors can begin building visuals immediately after selecting a dataset.
To use Fast Path
- Navigate to Insights Portal.
- Under the Analytics Builder tab, click Analytics Builder.
- Click the Datasets tab to show the list of available datasets.
- Click New dataset to begin creating a new dataset.
- Under FROM EXISTING DATA SOURCES, choose your source. For example, select Brightspace, then click Create dataset.
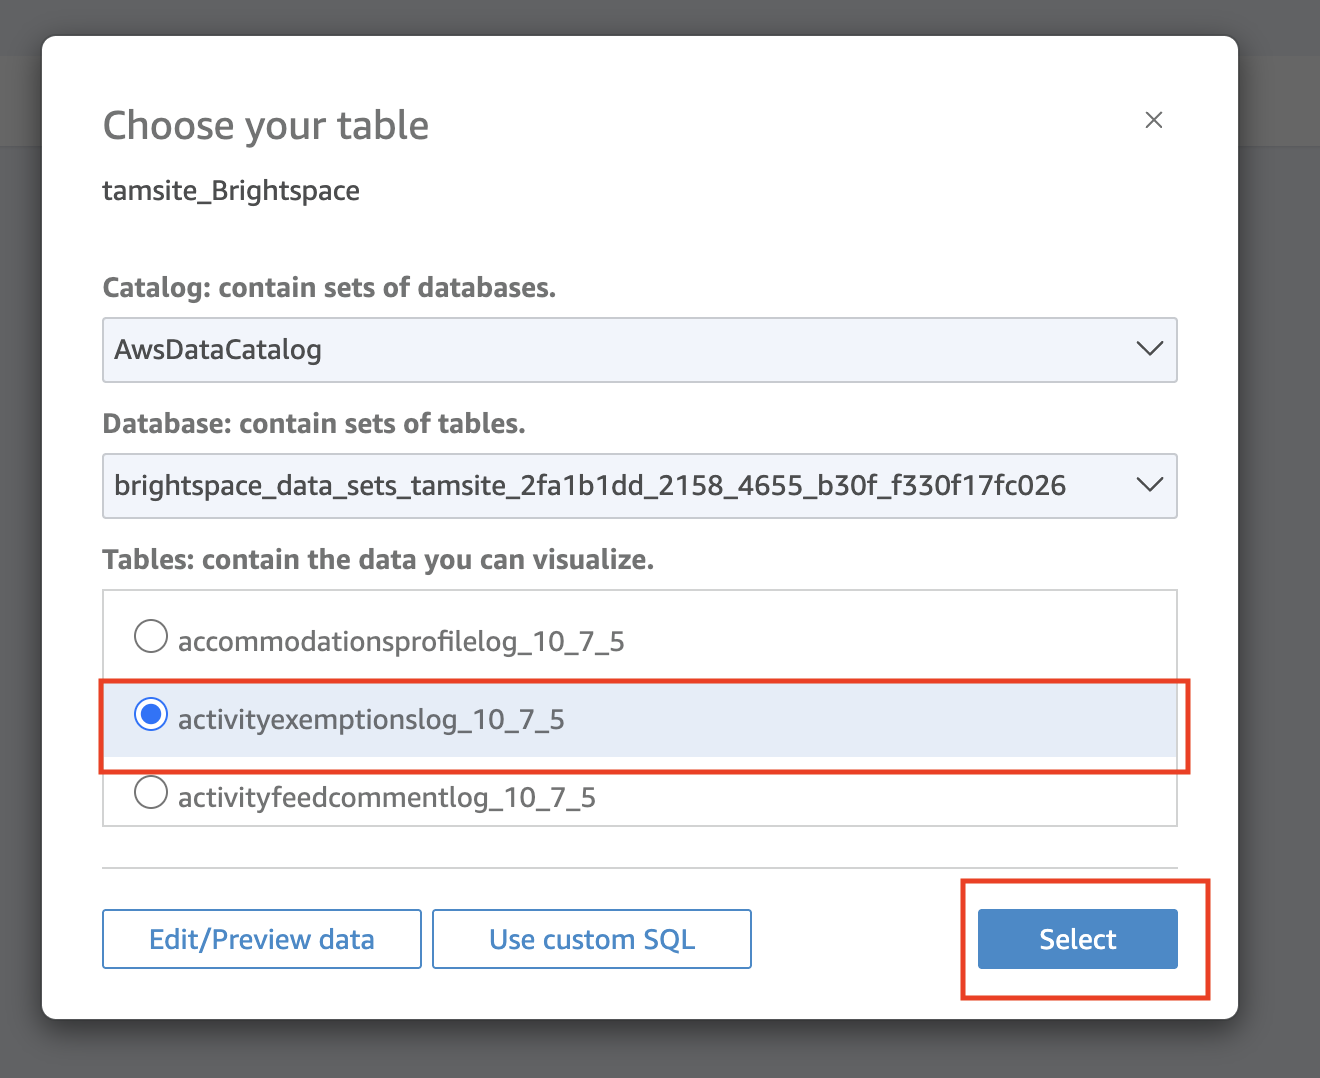
- Select the BDS you want to use and click Select.
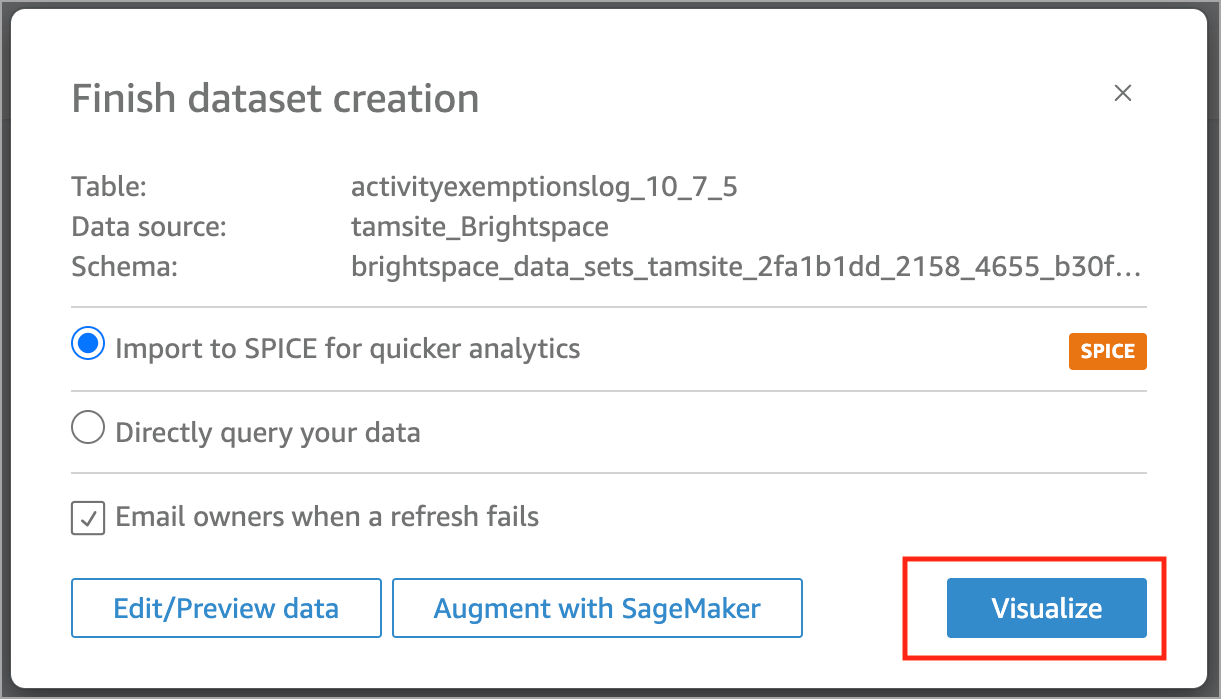
- Click Visualize.
This opens the dataset in an Analysis, allowing you to begin building visuals.
To open your dataset in edit mode
- From the Analysis, click the dataset name in the top left.
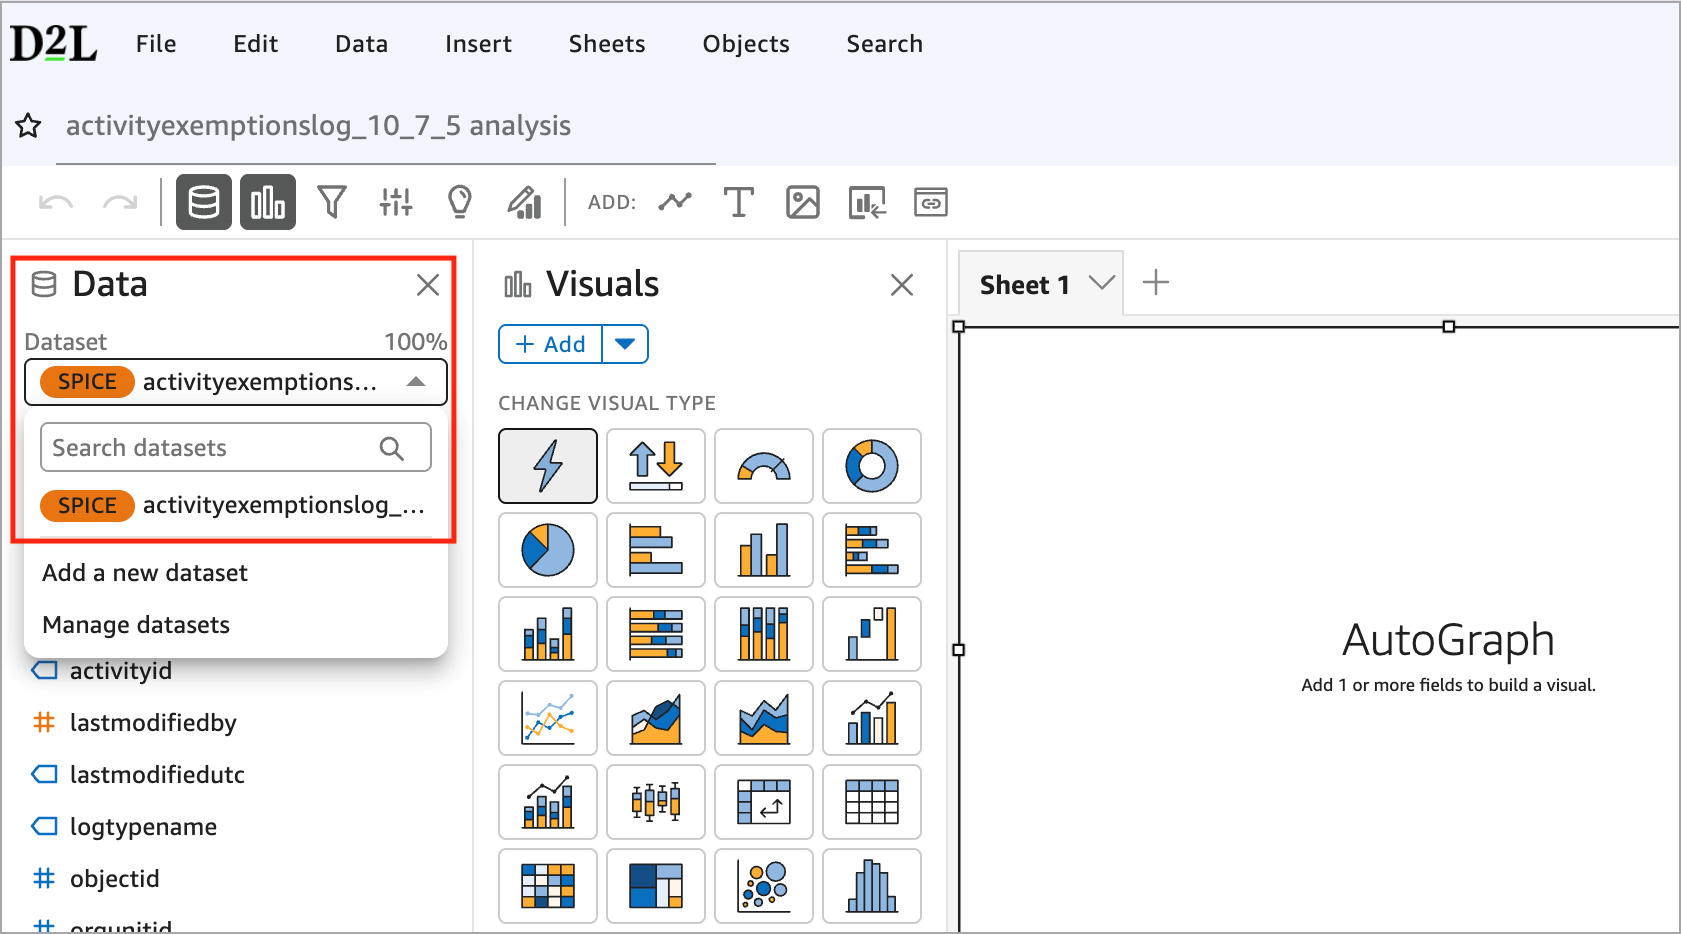
- Select Manage datasets.
- Click the three-dot menu beside your dataset and select Edit.
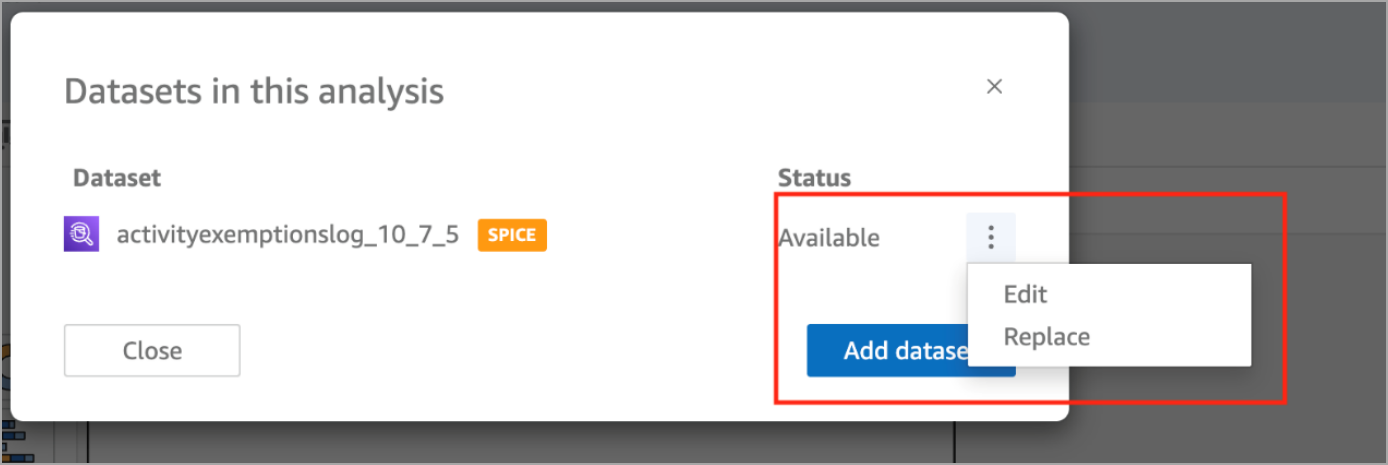
This opens the New Data Preparation Experience.
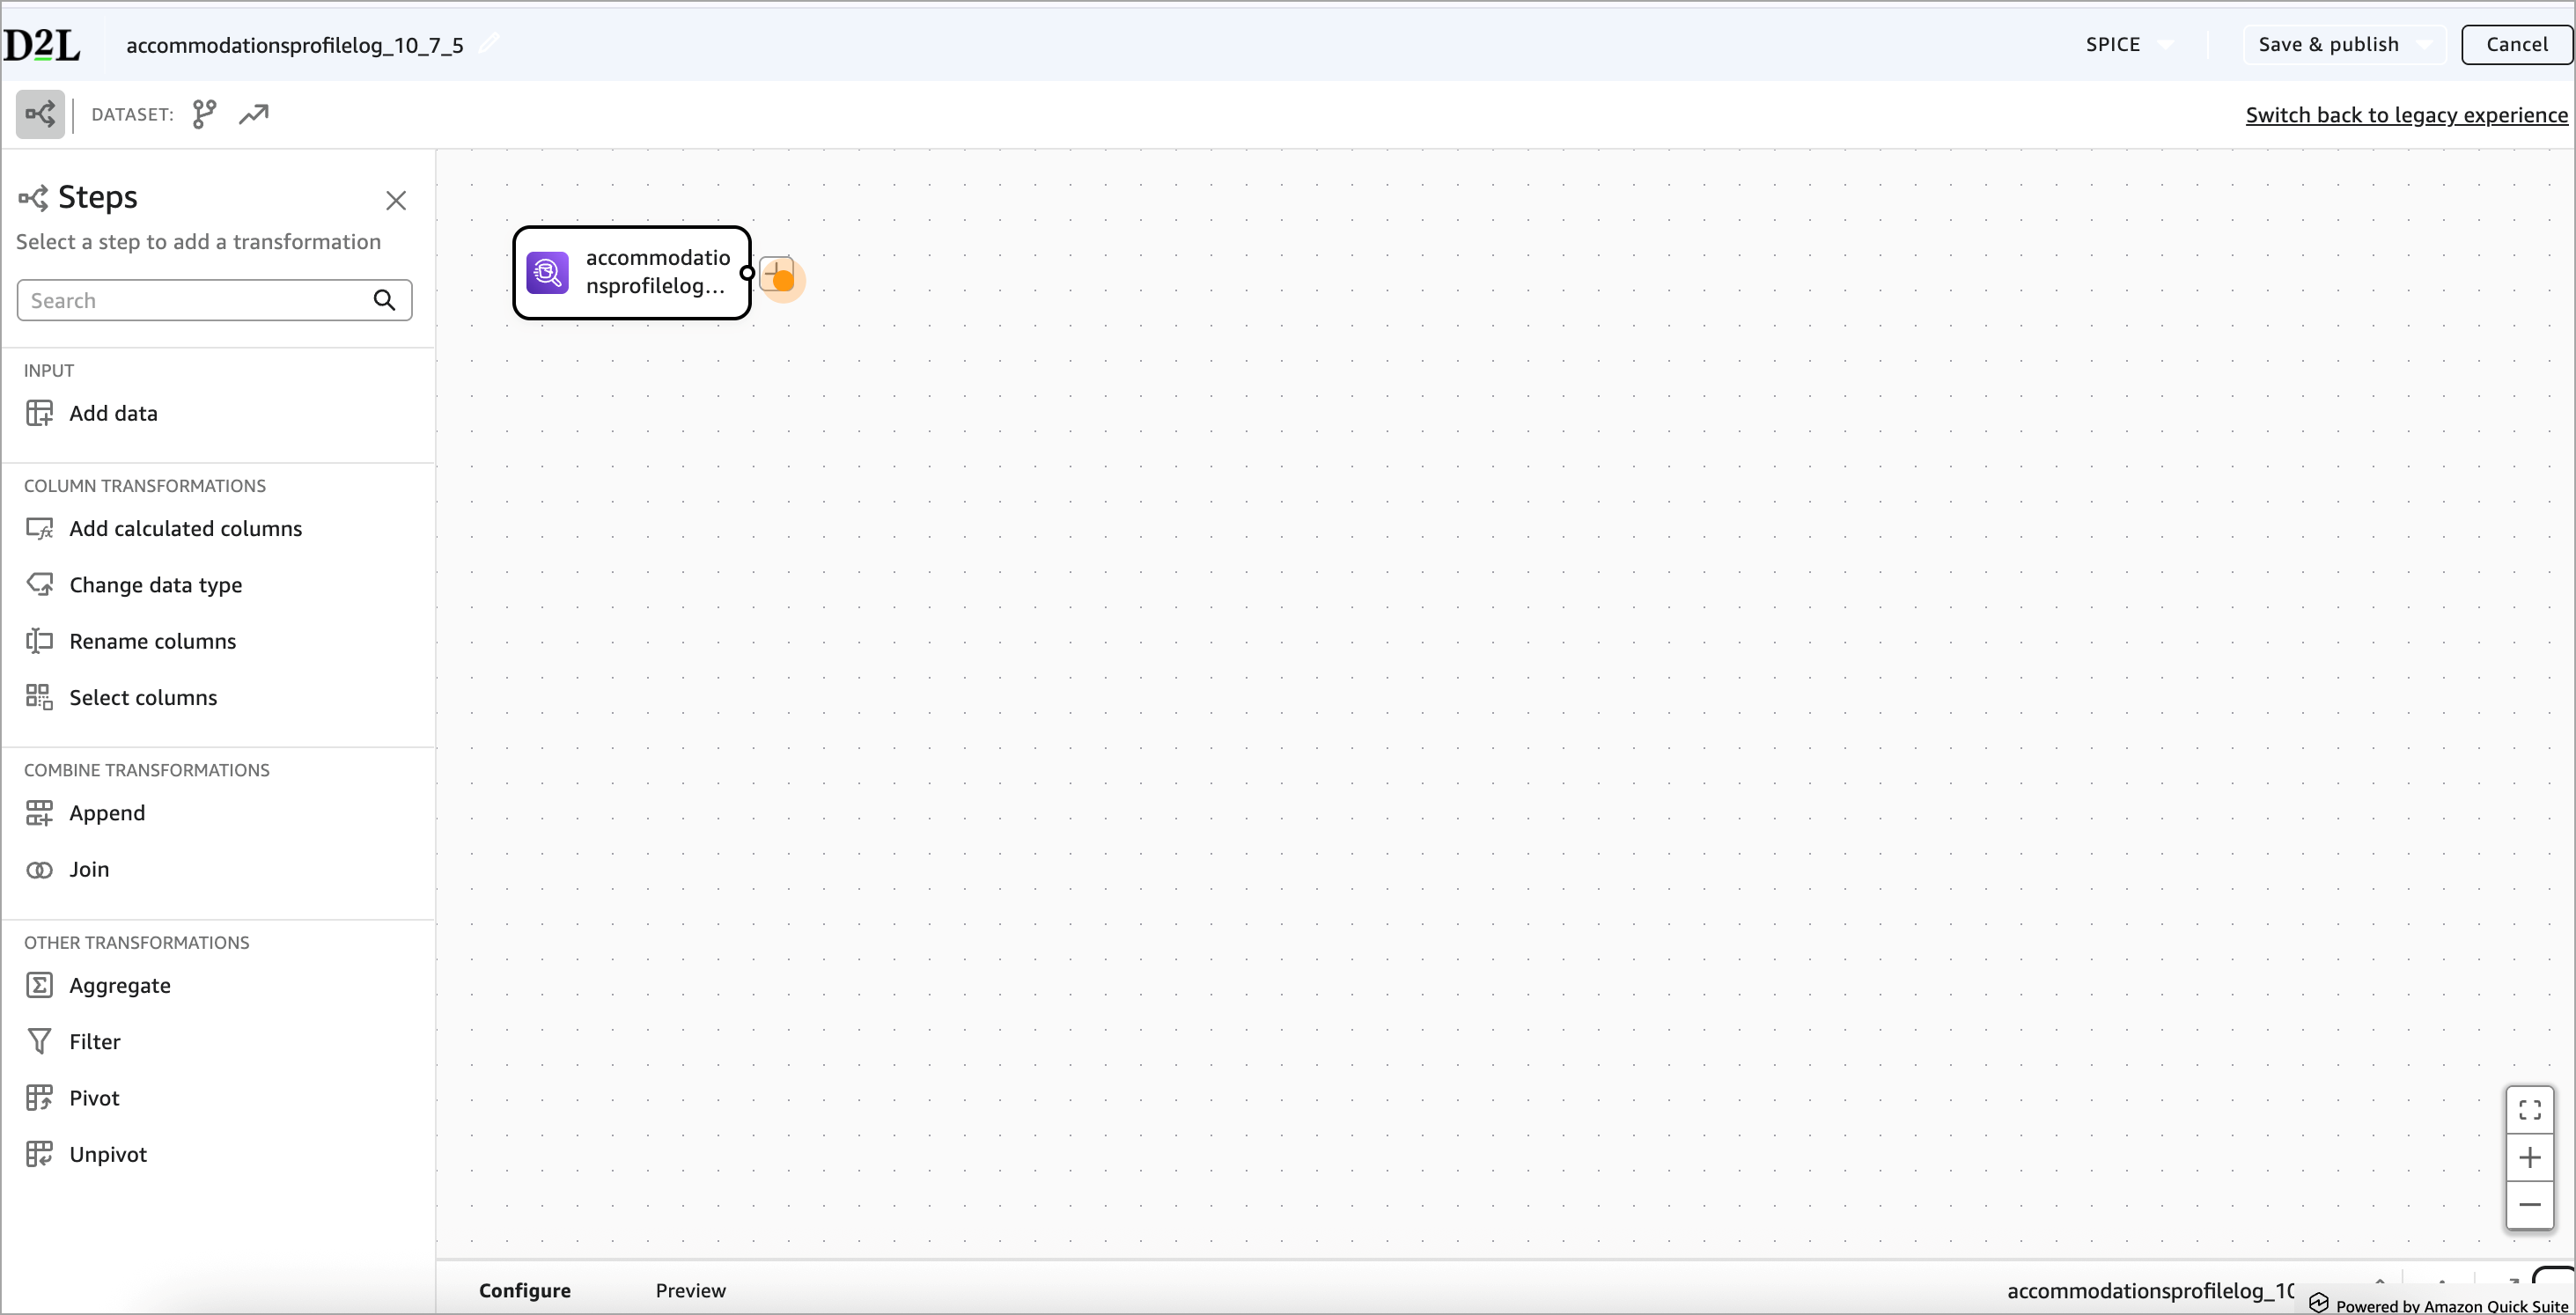
Overview of the New Data Preparation interface
Watch this video to learn how to navigate the New Data Preparation Experience in Analytics Builder. Review the written steps below.
When you open a dataset in the new experience, the screen contains four main areas:
- Workflow Canvas (center area)
- Left Pane (Steps panel)
- Configure & Preview Panels (bottom area)
- Toolbar (top right)
Workflow Canvas
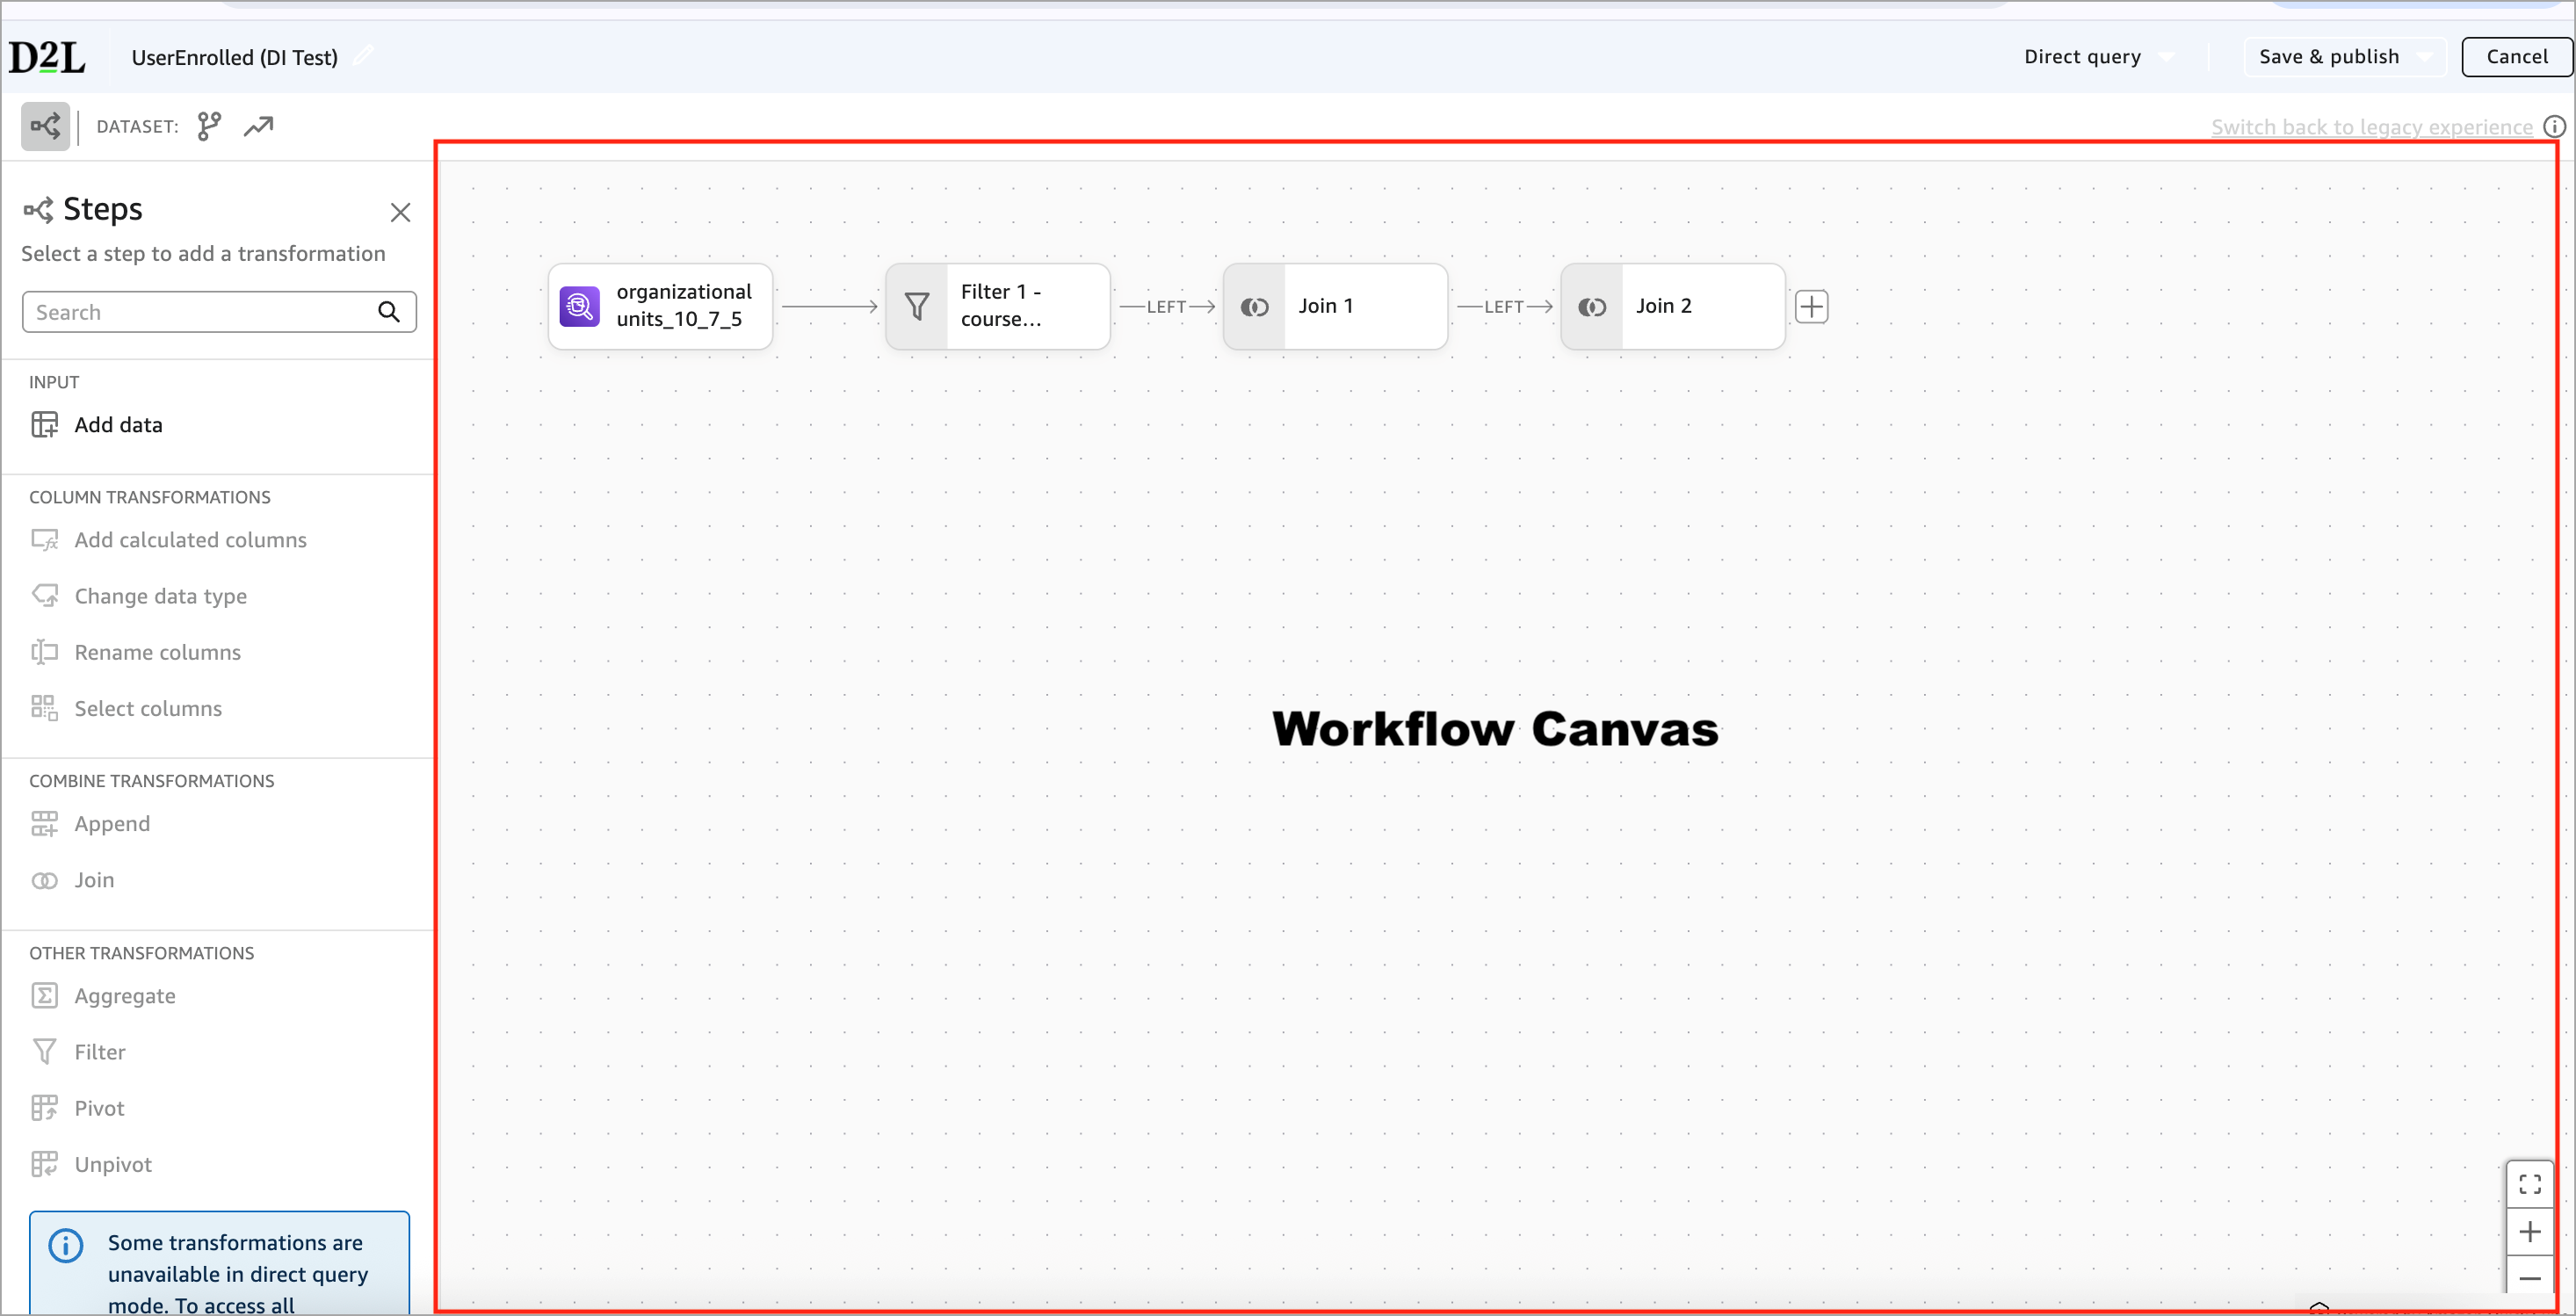
The Workflow Canvas shows your dataset as a series of connected steps. Each step represents one action taken on the data. For example:
- Input (your starting data source)
- Filter
- Select Columns
- Rename Columns
- Join
- Aggregate
- Publish
This allows you to view the complete dataset workflow from start to finish. You may start with a single data source and apply one or two transformations.
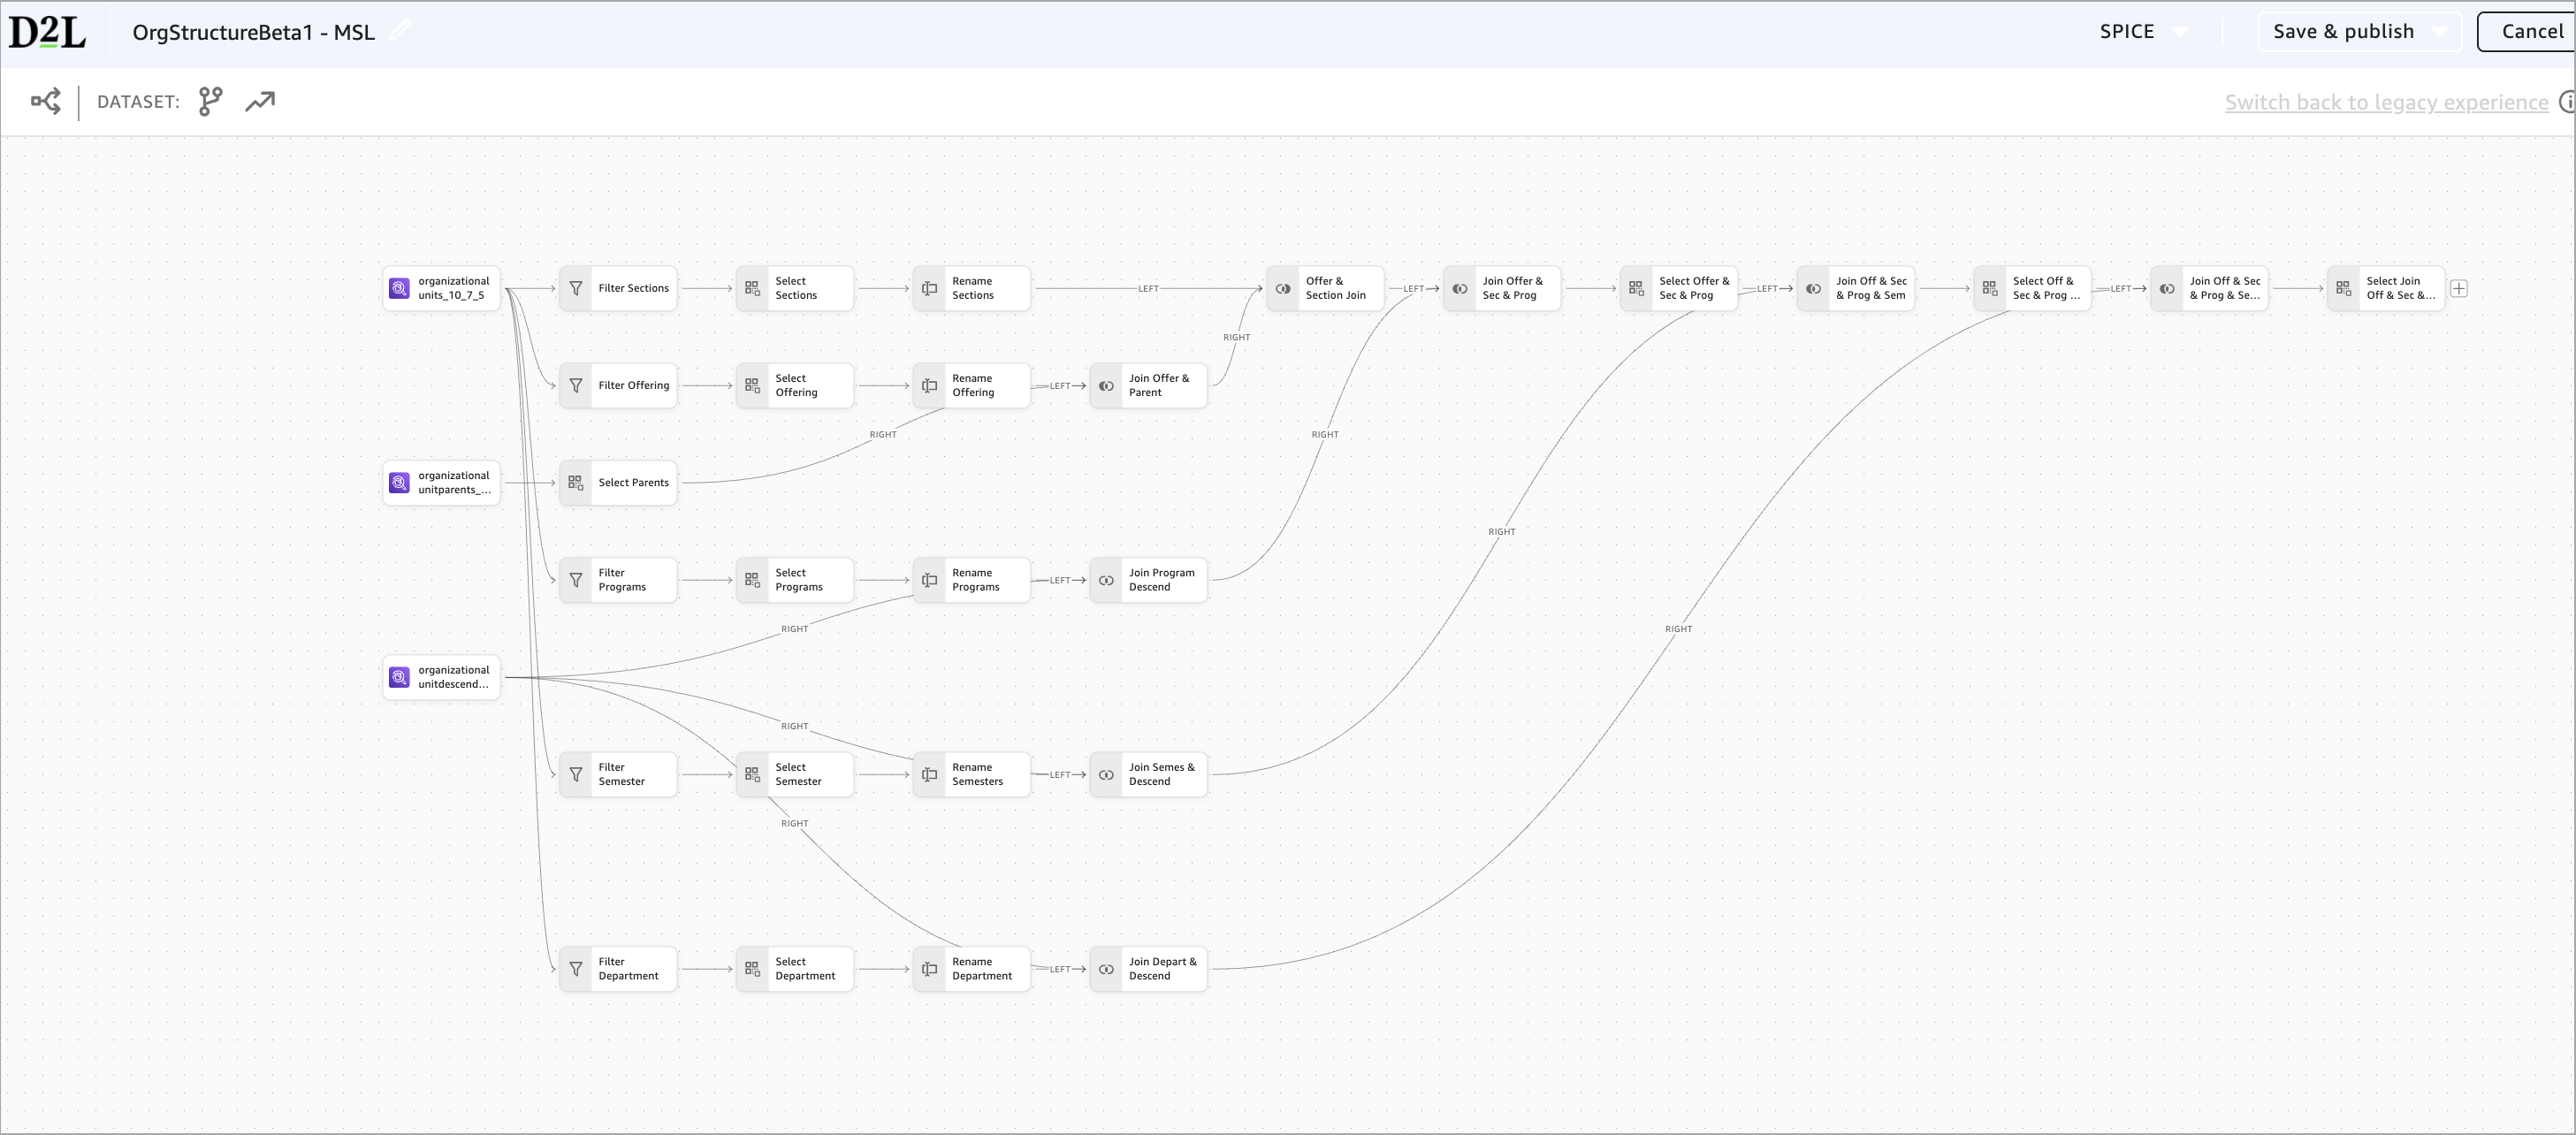
The workflow can also support more advanced dataset building. When your logic requires separate transformation paths, the canvas displays branches, allowing each path to evolve independently before being joined back together. The following example shows how the canvas handles more advanced dataset building:
- Several Organizational Unit datasets are used as inputs.
- Each branch applies its own transformations (Filter, Select, Rename).
- The branches are later joined together.
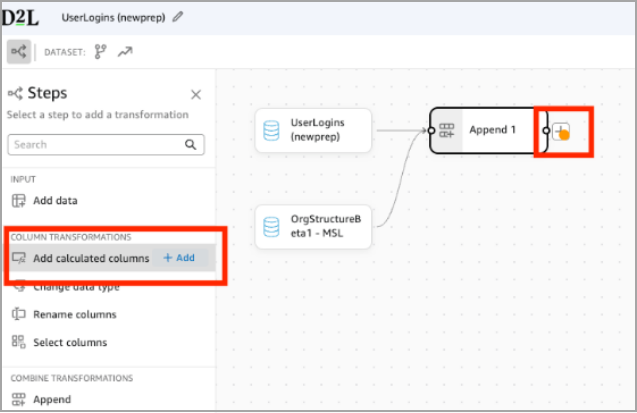
Left Pane
The left pane shows every transformation you can apply, grouped into categories.
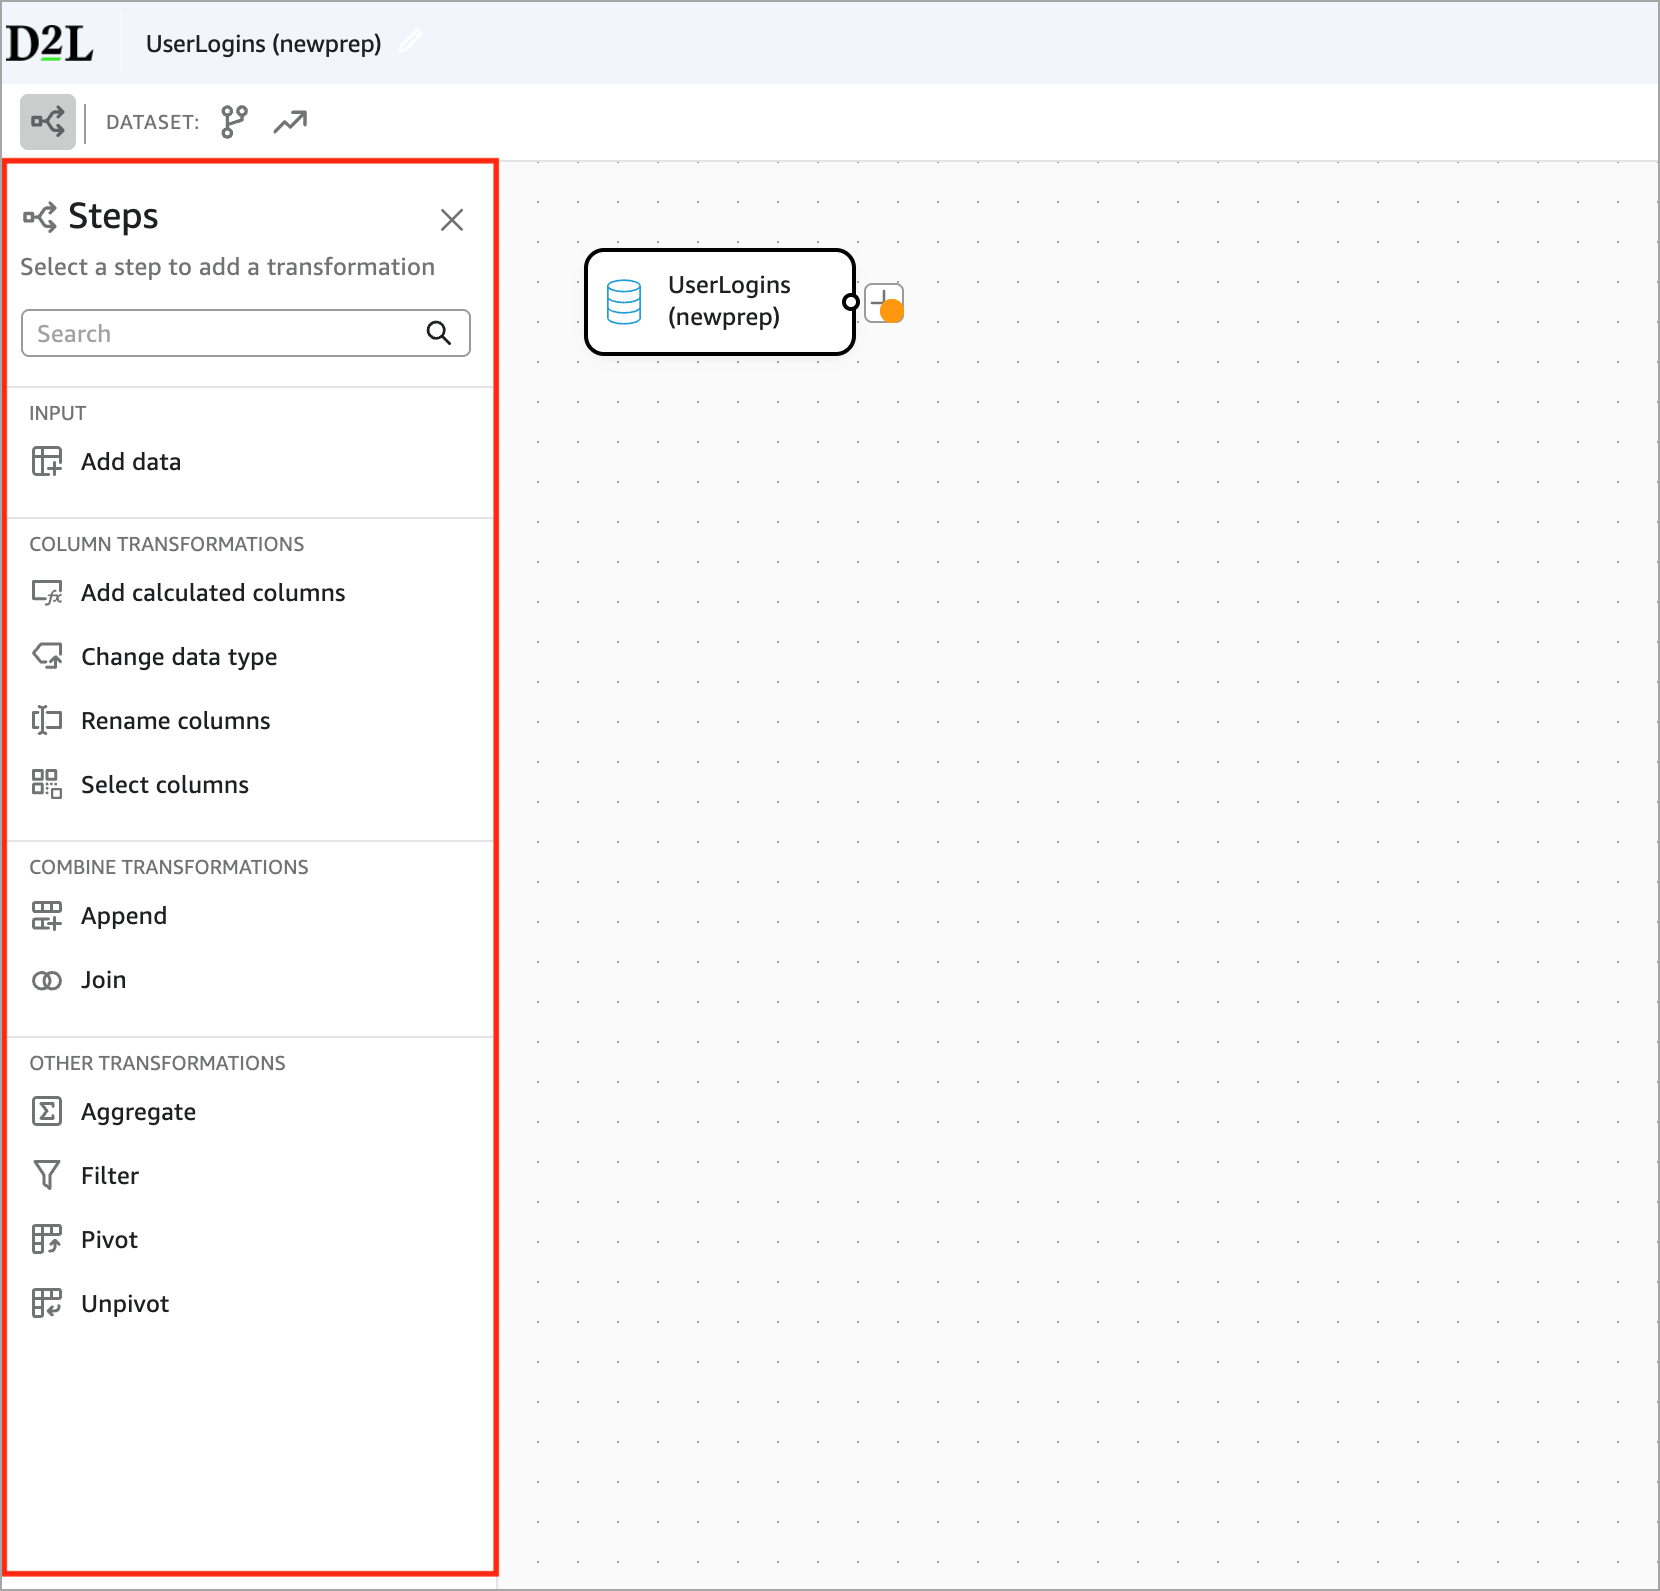
Authors can add a transformation by clicking +Add in the left pane or by clicking + directly on the Workflow Canvas.
Data Preview & Configuration Panels
When you select any step in the workflow, the bottom area of the screen displays two panels: Configure and Preview.
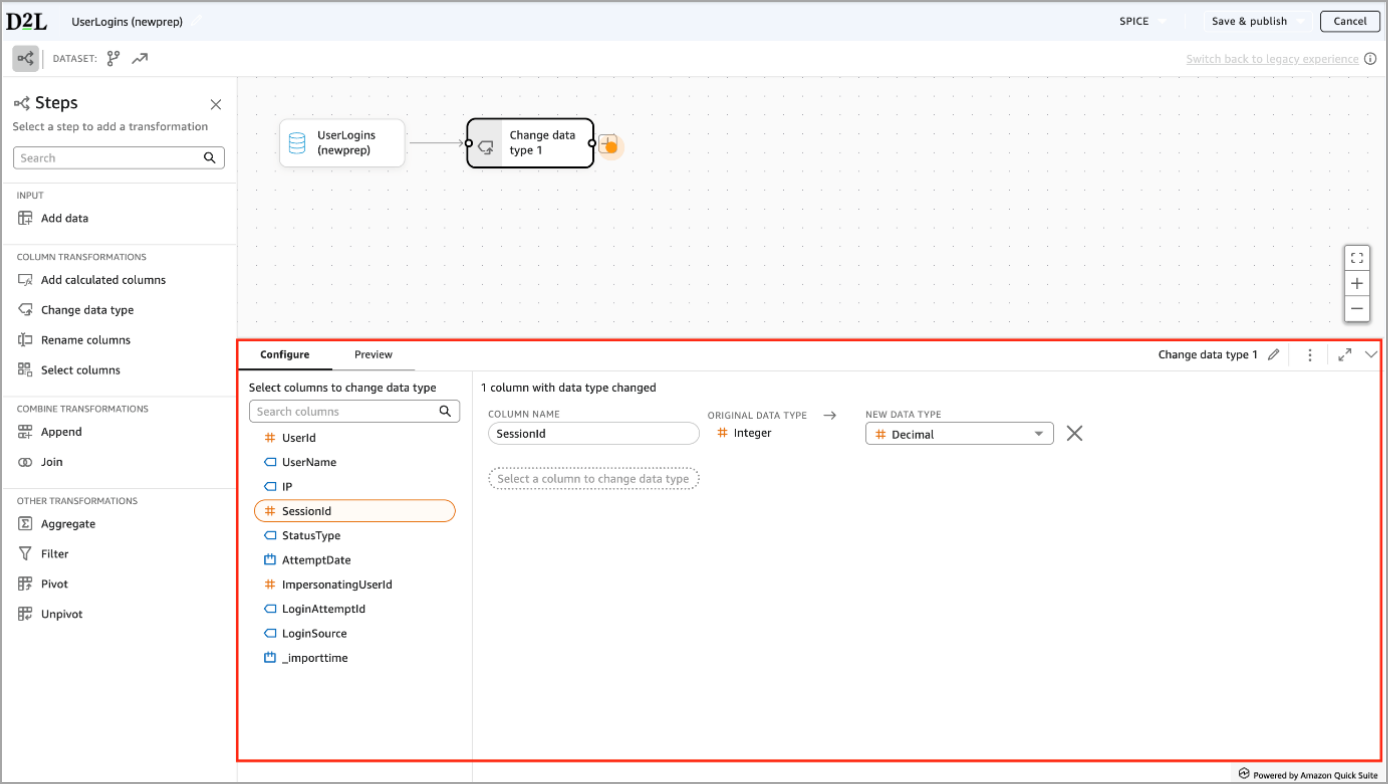
Configure is where you define what the step does and ensure you set the transformation correctly. The Configure tab lets you:
- Select which columns to modify
- See the original data type
- Choose a new data type
- Confirm what will change before applying it.
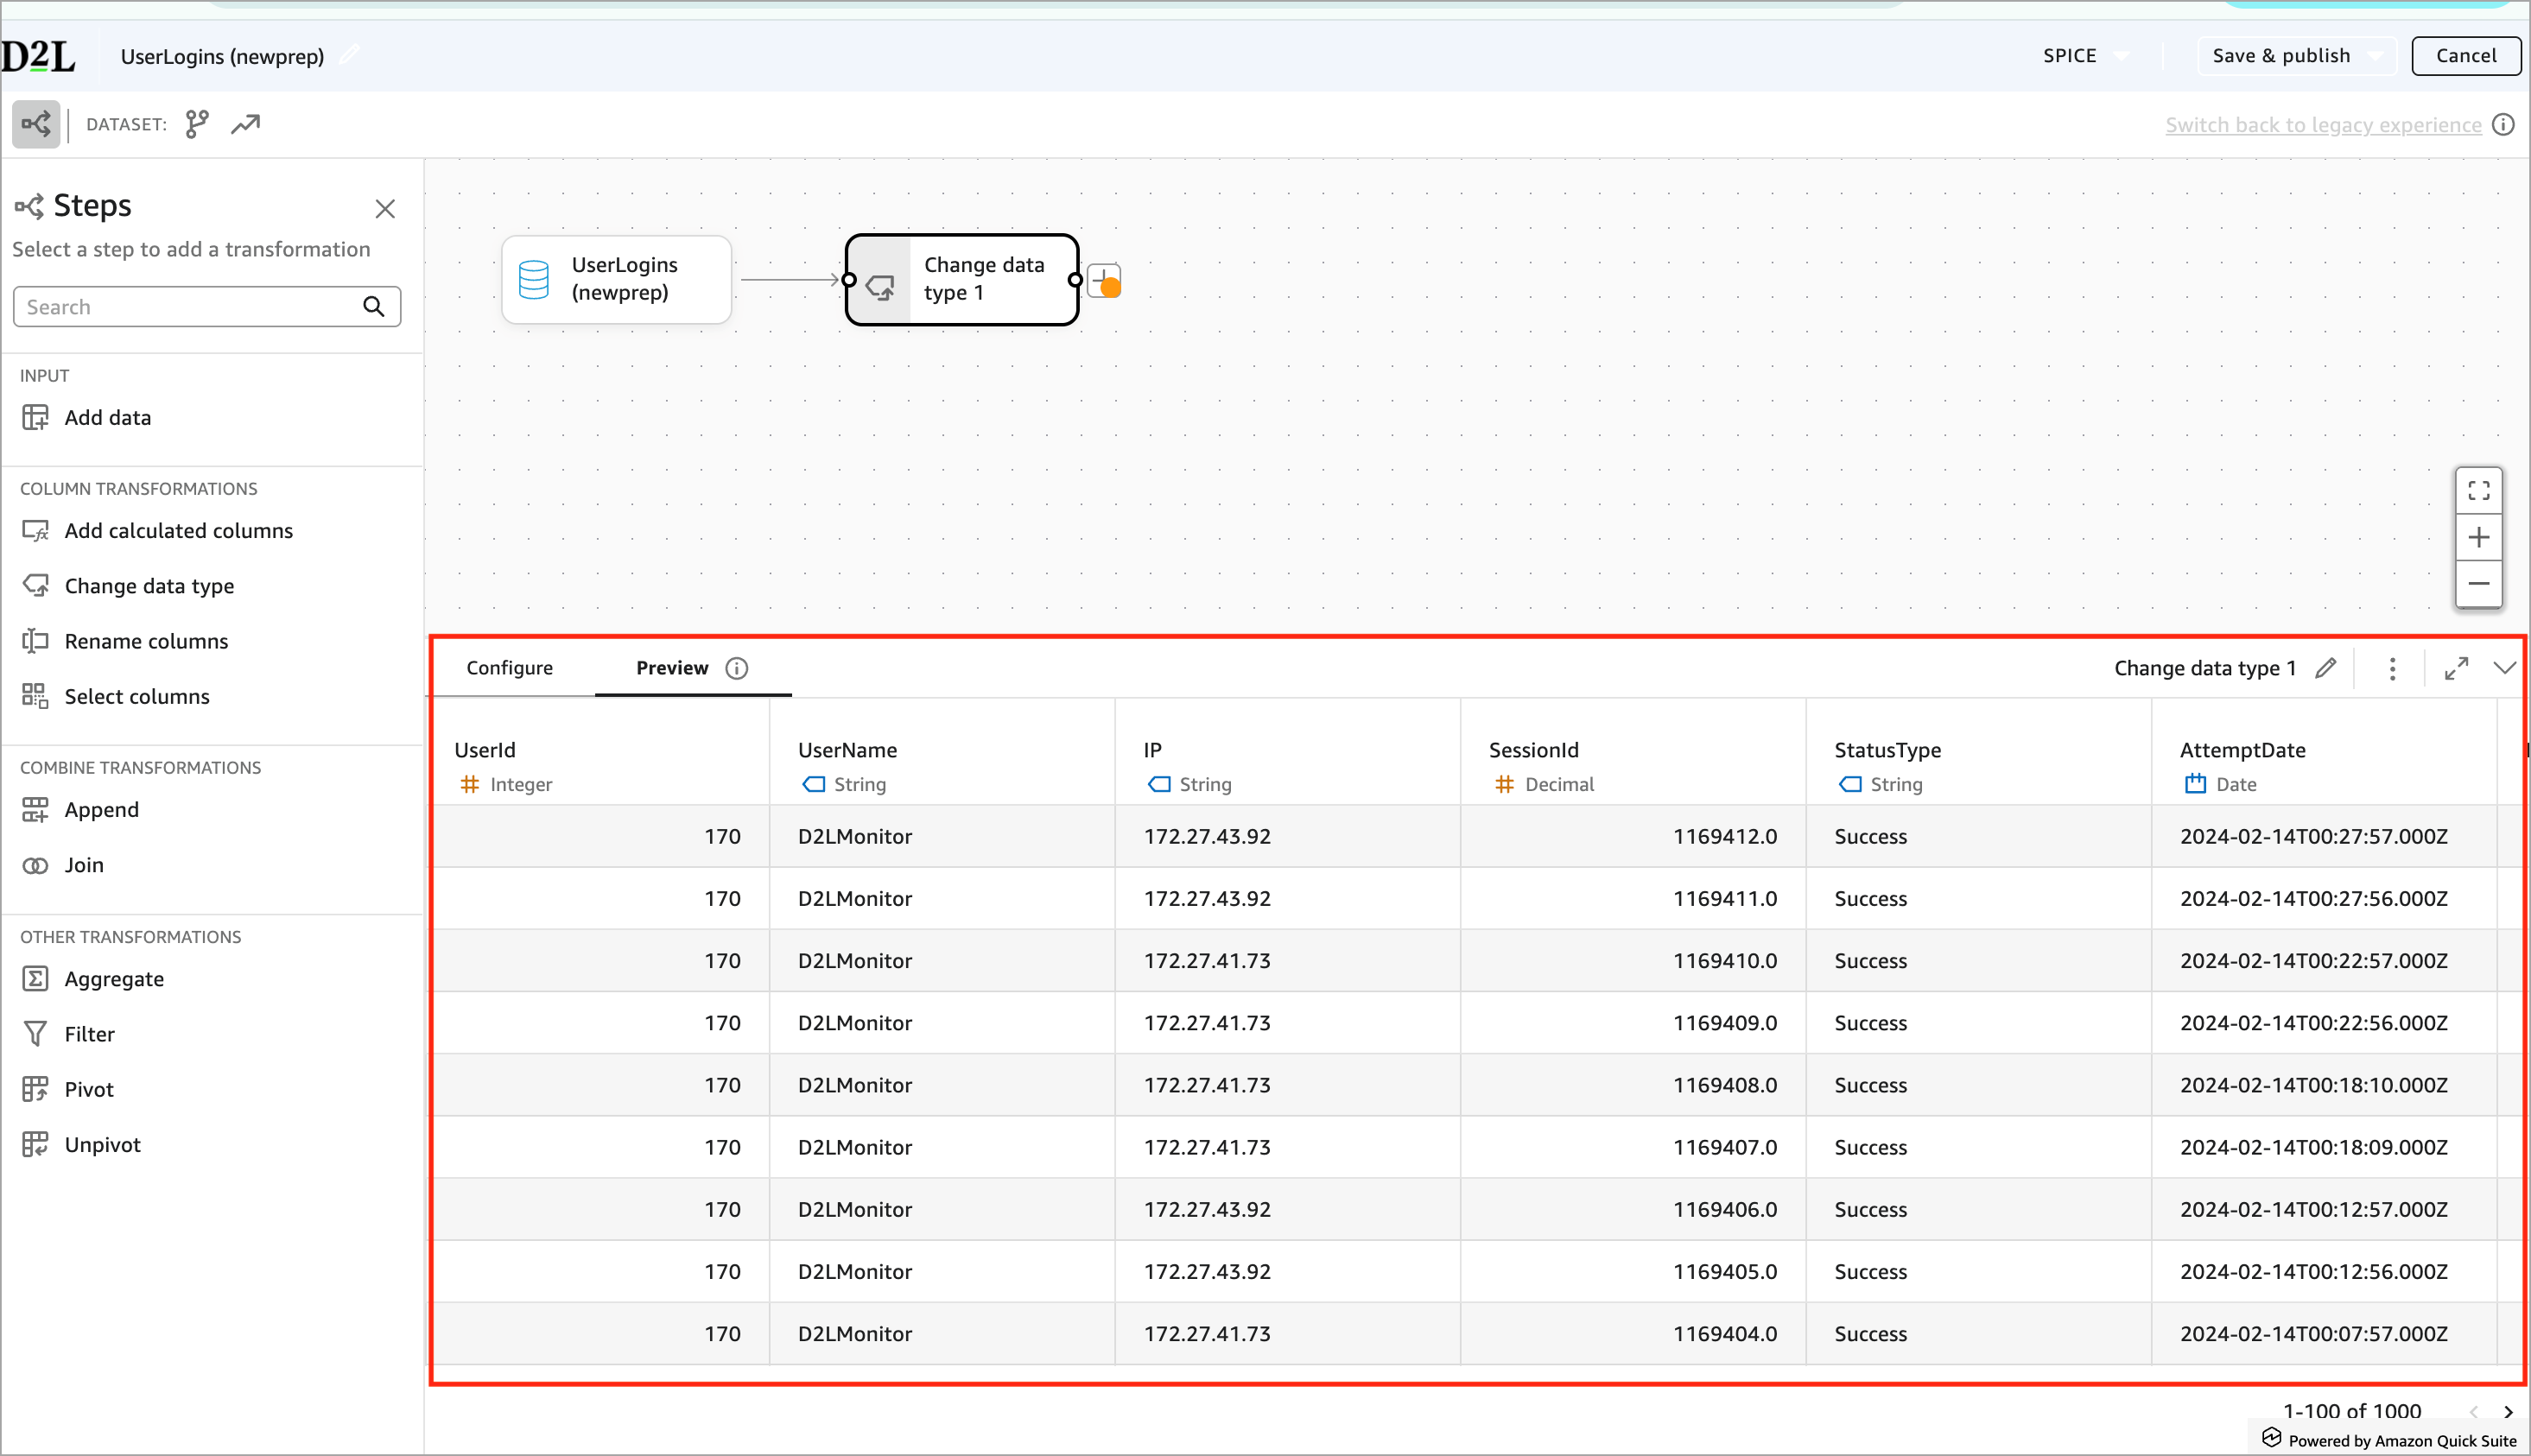
Preview is where you verify the results of the step.
After configuring the transformation, the Preview panel updates and shows:
- SessionId is now displayed as Decimal
- Visual confirmation that the transformation worked as intended.
The Configure and Preview panels help authors validate the change immediately before moving on. This two-step interaction reduces mistakes and increases confidence in the final dataset.
Toolbar
The toolbar gives you quick access to the most important dataset controls. It always appears at the top of the screen while you build your dataset. The name of the dataset always displays in the top left.
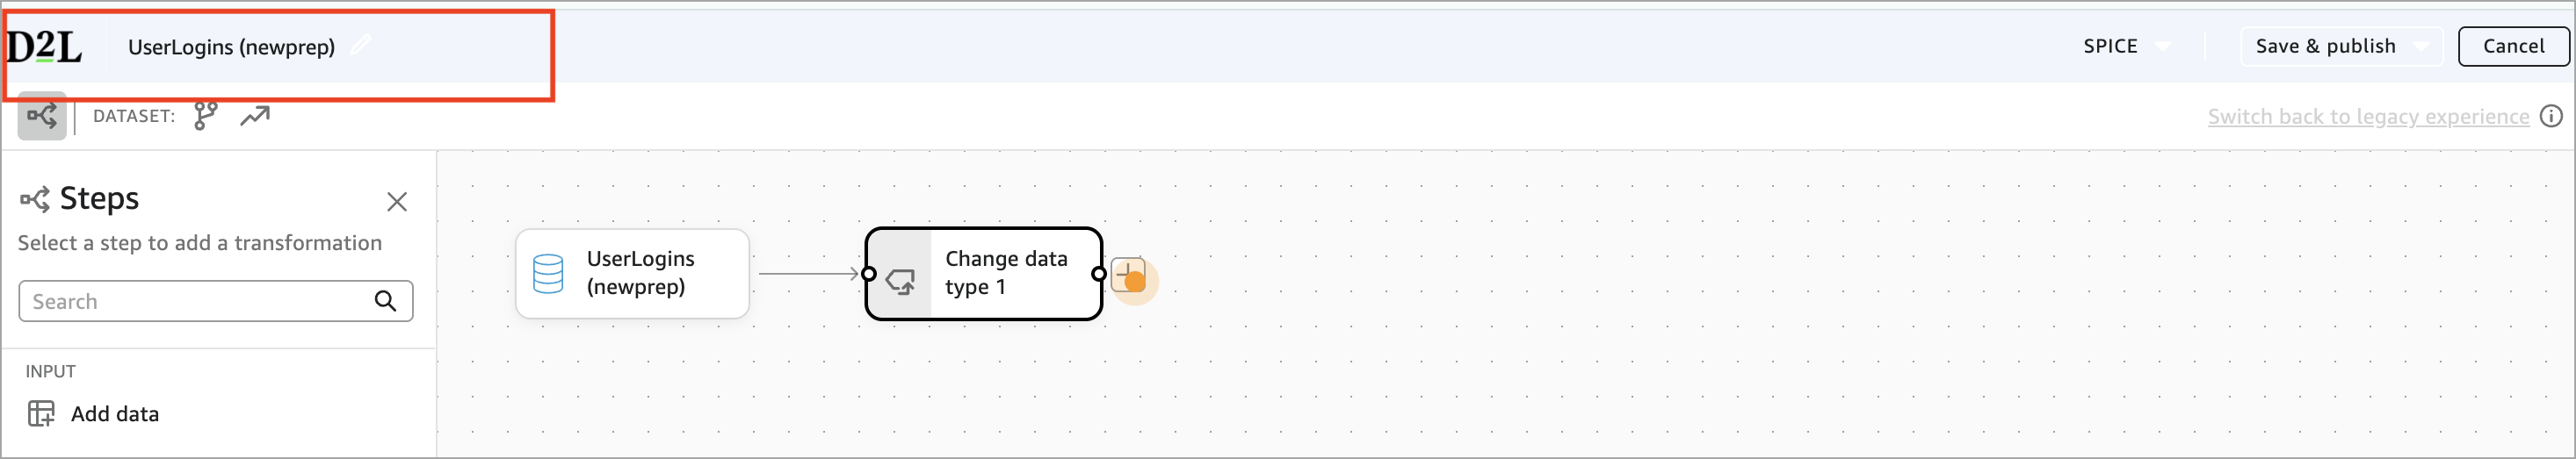
Edit Dataset Name
Click the dataset name to rename it. Renaming updates it everywhere the dataset is used.
Query Mode Detector
The toolbar shows whether your dataset is using SPICE or Direct query. This choice affects which transformations are available.
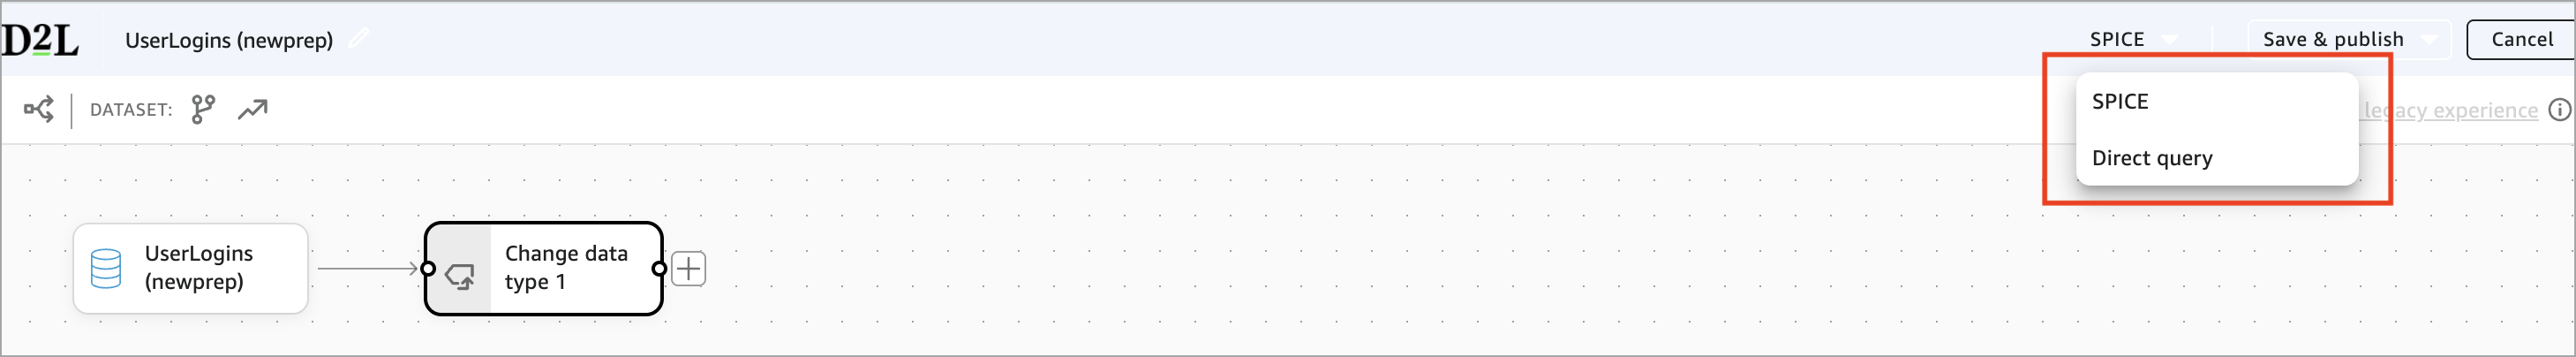
Query Mode: SPICE vs DirectQuery
Use SPICE when you want the full capabilities of the New Data Preparation Experience.
SPICE allows transformations that reshape or summarize your data, including:
- Pivot
- Unpivot
- Aggregate
- Append
- Complex or multi-step workflows (including branches)
SPICE loads your data into a fast, in-memory engine. This lets Analytics Builder perform heavy operations that cannot run efficiently against live database queries.
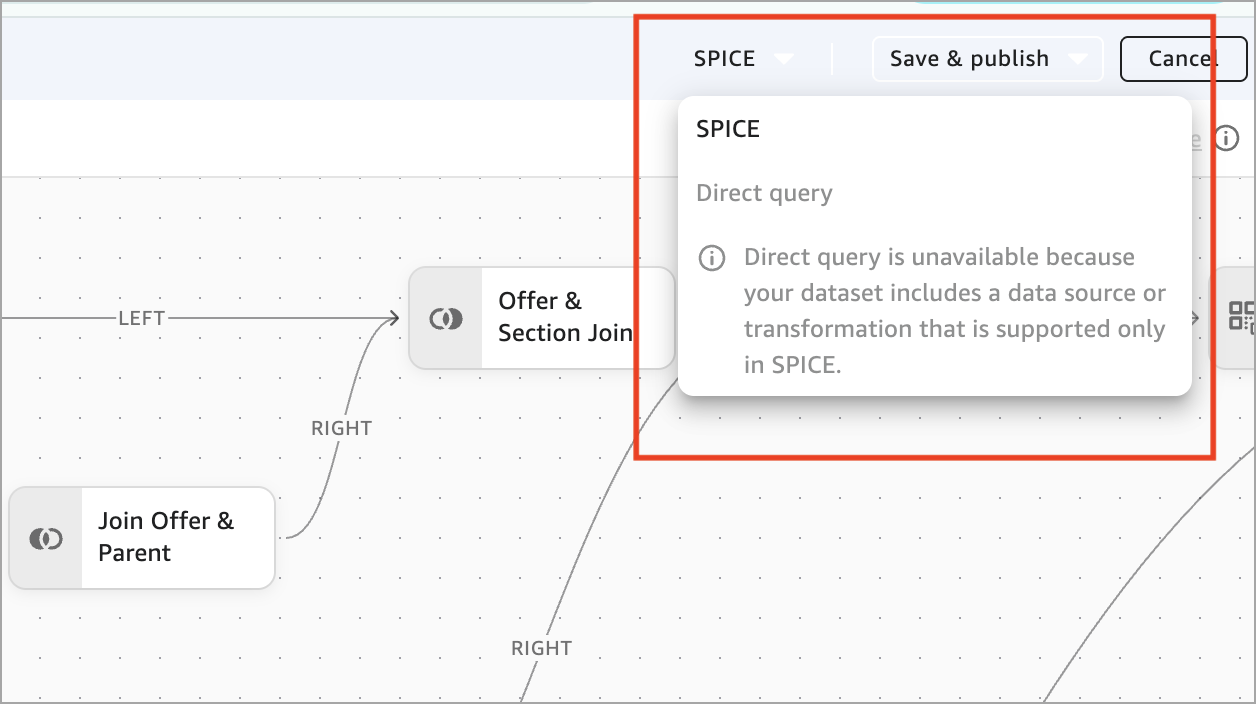
|
Important: If you add any of the above transformations, your dataset becomes SPICE-only and you won't be able to select the DirectQuery option as shown in the example below.
|
DirectQuery supports basic, lightweight operations including:
- Filters
- Select, Rename, Change Data Type
- Basic Calculated Fields
- Simple Joins (with some limits)
DirectQuery does not support Pivot, Unpivot, Aggregate, Append, Complex or multi-branch workflows.
Save & Publish
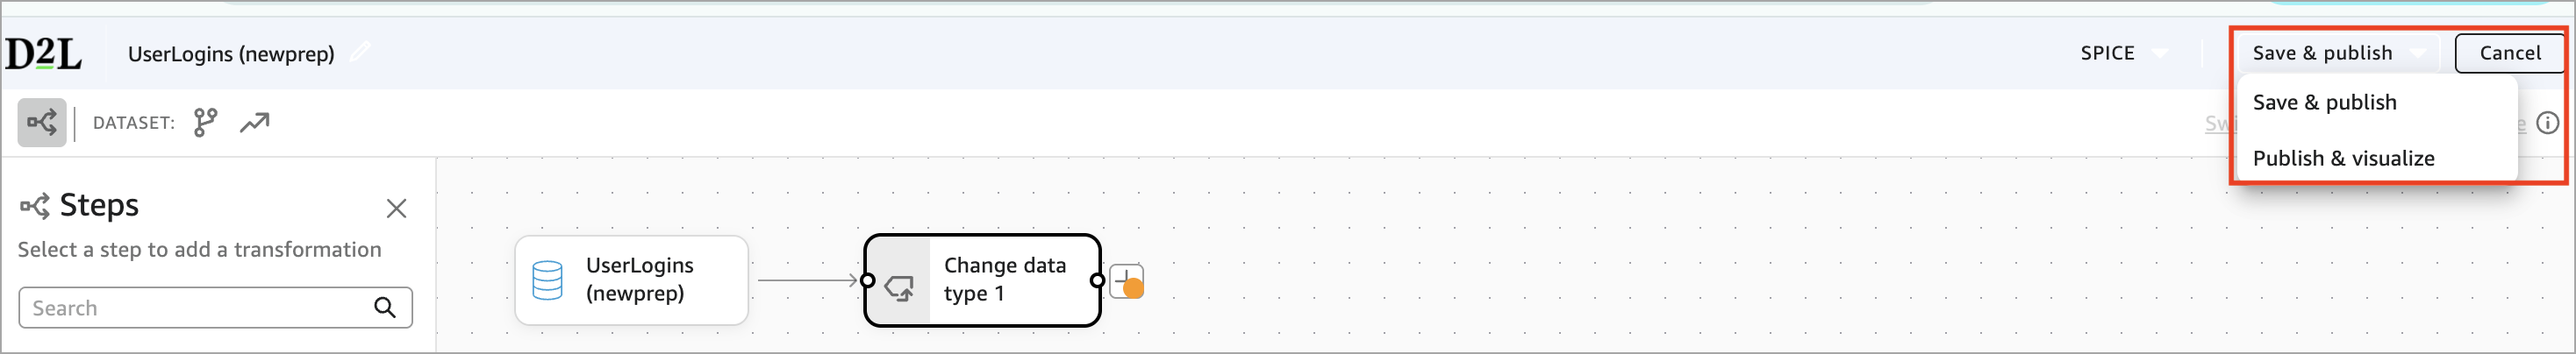
The toolbar includes two publishing options, depending on what you want to do next.
- Click Save & Publish to make your dataset available for analyses and dashboards.
- Click Publish & Visualize to publish the dataset and open it as a new analysis so you can start building visuals right away.
|
Important: Once you publish a dataset created in the New Data Preparation Experience, it cannot be edited using the legacy data preparation experience. All future edits will always open in the new experience.
|
Cancel
Click Cancel to end your current editing session and return to the Datasets tab.
Transform datasets using the New Data Preparation Experience
The new Data Preparation Experience lets you build datasets using a visual, step-by-step workflow. Each transformation appears as a tile on the canvas, and the Preview tab in the bottom panel shows the results immediately.
Below is an overview of how to add data, apply transformations, and use more Advanced Capabilities.
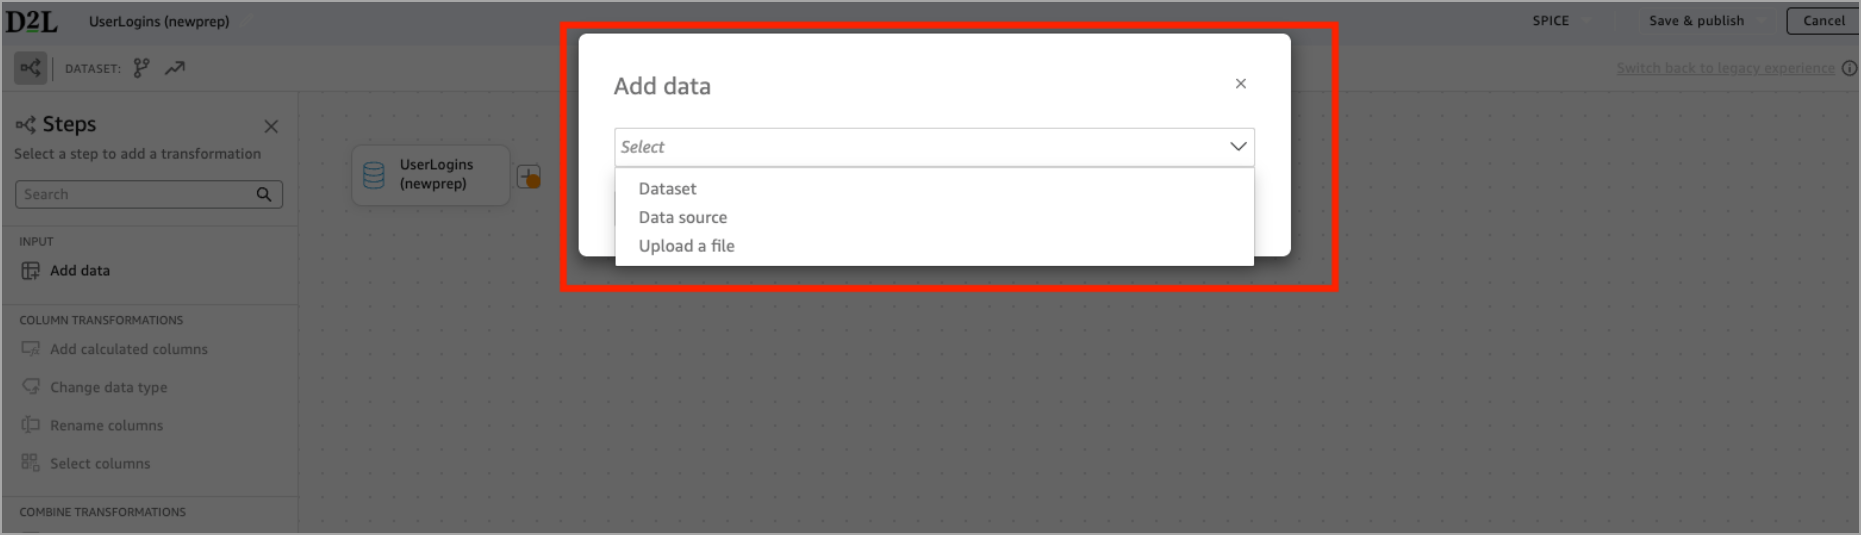
Add data
Every dataset begins with an input step. To add a data source:
- From the Input tile, click Add Data.
- Select one of the following: Dataset (for custom datasets), Data source, (for Brightspace Data Sets), or Upload a file.
Common transformations
Watch this video to learn how to use common transformations such as Add calculated columns, Filter, Select columns, and Rename columns steps in Analytics Builder. Review the written steps below.
Filter
Use Filter to keep only the rows that match specific conditions. The Filter narrows your dataset based on rules you define (for example: Keep only Sections, only Active users, only current semesters).
- From the left pane, click Filter. You can also click the + icon on the canvas and choose Filter.
- In the Configure panel below, choose a column, pick a condition and enter a value.
- Verify the filtered results in the Preview panel.
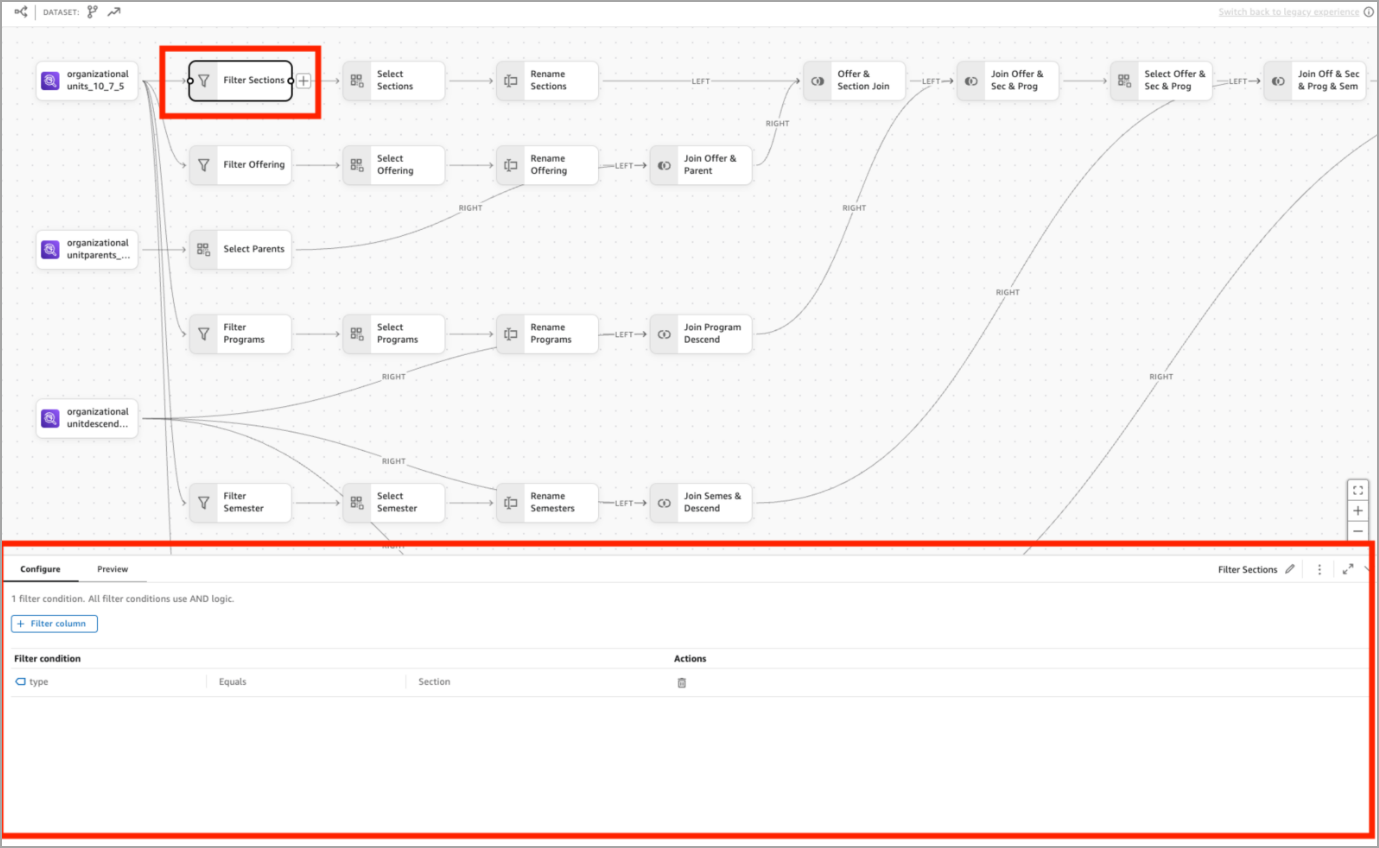
Filter is supported in both SPICE and DirectQuery.
Select columns
Use Select columns to choose which fields you want to keep in your dataset. This step removes any irrelevant columns that you don’t need.
- From the left pane, click Select columns. You can also click the + icon on the canvas and choose Select columns.
- In the Configure panel below, select the columns you want to include.
- Reorder the columns if needed.
- Use the Preview panel to confirm that only the selected fields are visible.
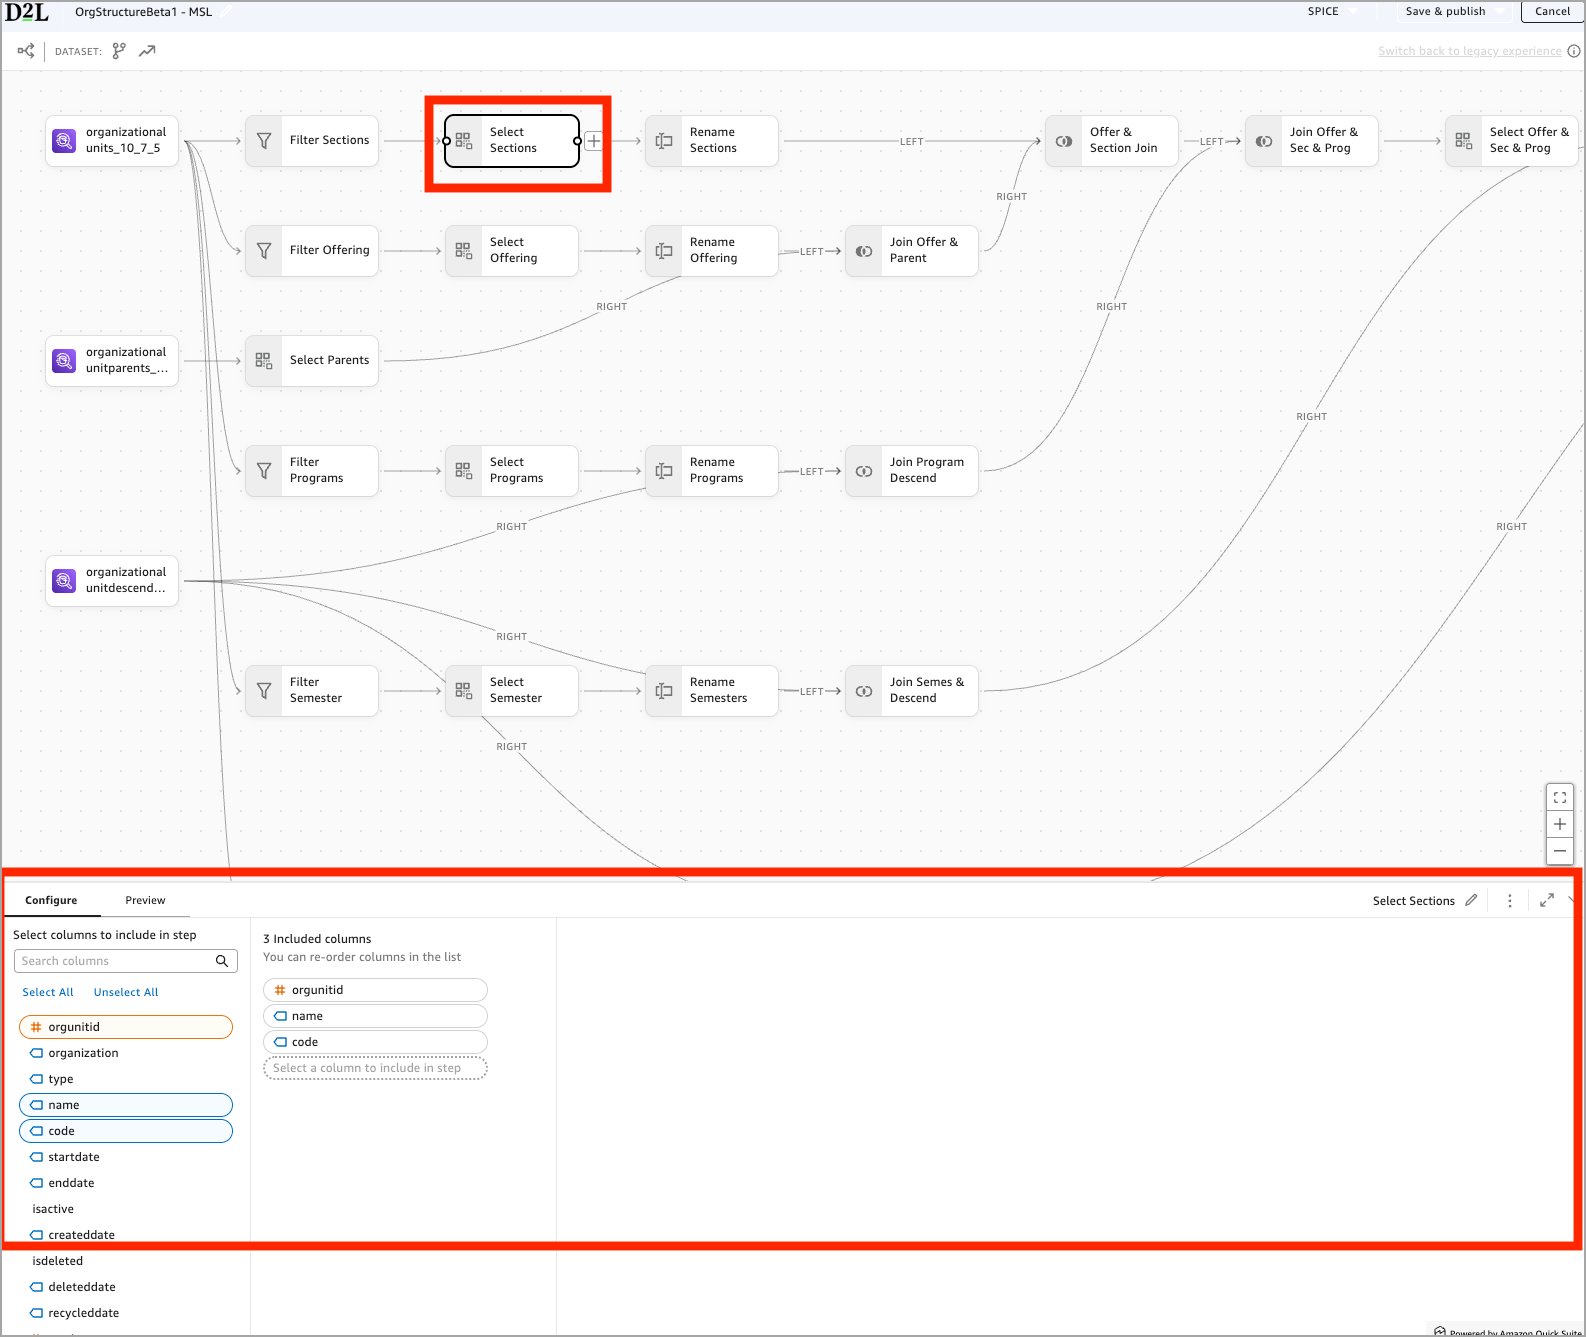
Select columns is supported in both SPICE and DirectQuery.
Rename columns
Use Rename columns when you want to give field names clearer, more meaningful titles before using them in visuals or joining them with other data sources.
- From the left pane, click Rename columns. You can also click the + icon on the canvas and choose Rename columns.
- In the Configure panel below, select the columns you want to rename.
- Enter the new names under New Name.
- Use the Preview panel to confirm that the field names have changed.
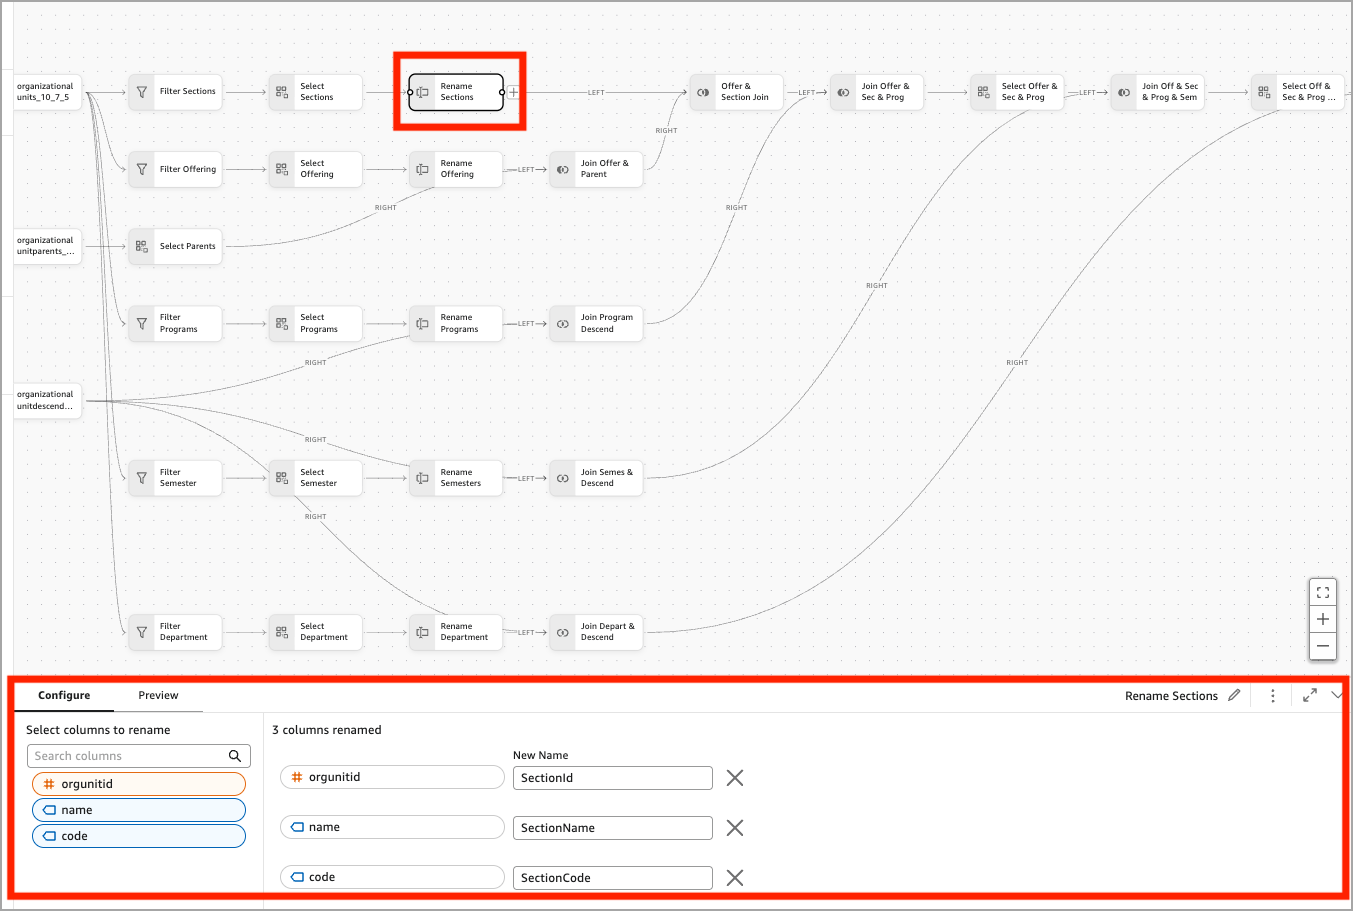
Rename columns is supported in both SPICE and DirectQuery.
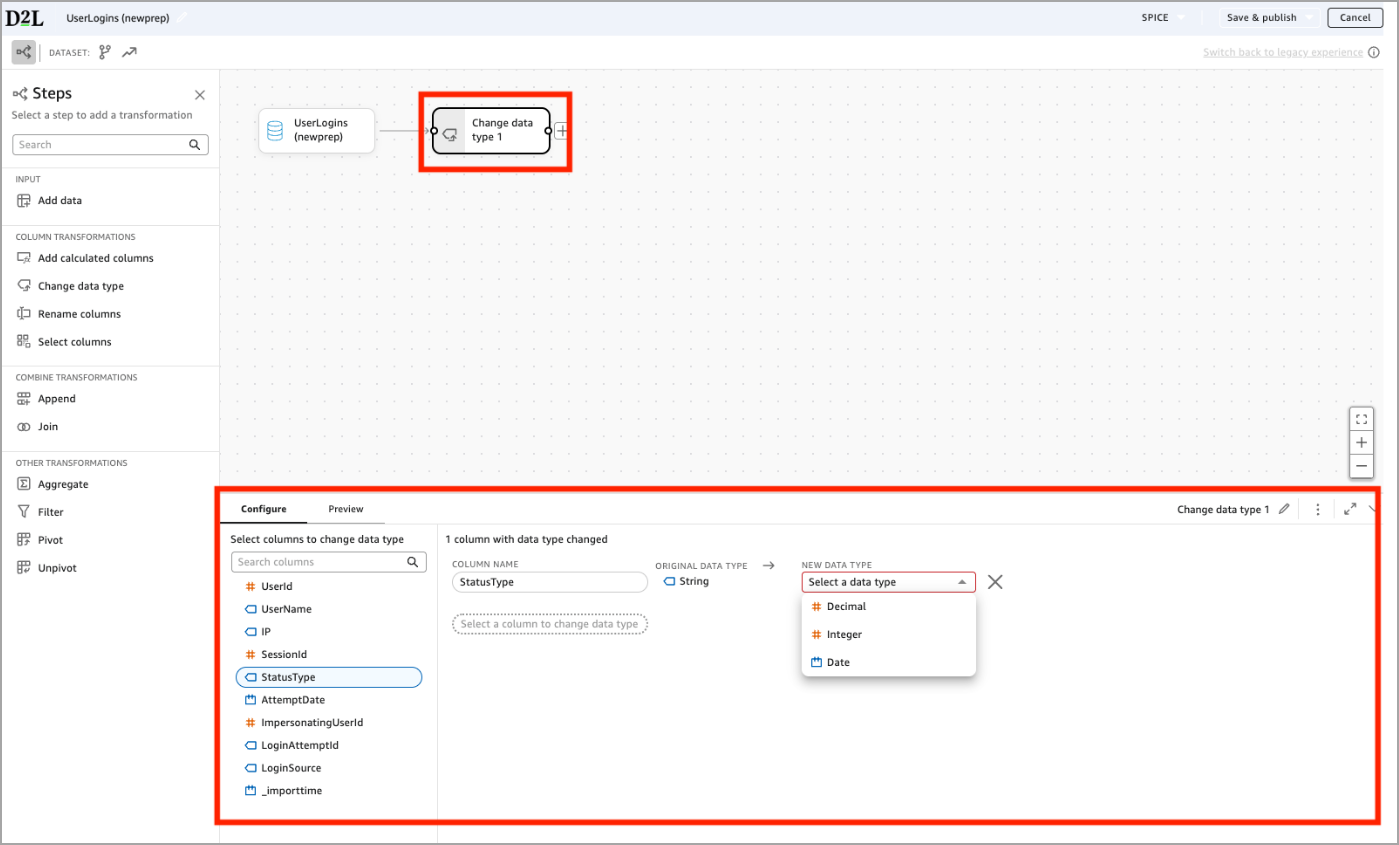
Change data type
Use Change data type when you need a column to behave as a different data type. For example, you may need to convert a numeric field stored as String into an Integer or Decimal.
- From the left pane, click Change data type. You can also click the + icon on the canvas and choose Change data type.
- In the Configure panel below, select the columns you want to modify.
- Use the NEW DATA TYPE dropdown to select the new type.
- Use the Preview panel to confirm the dataset contains the new data types.
Add calculated columns
Use Add calculated columns when you want to create new fields based on formulas. For example, you may need to calculate a duration using a start time and an end time.
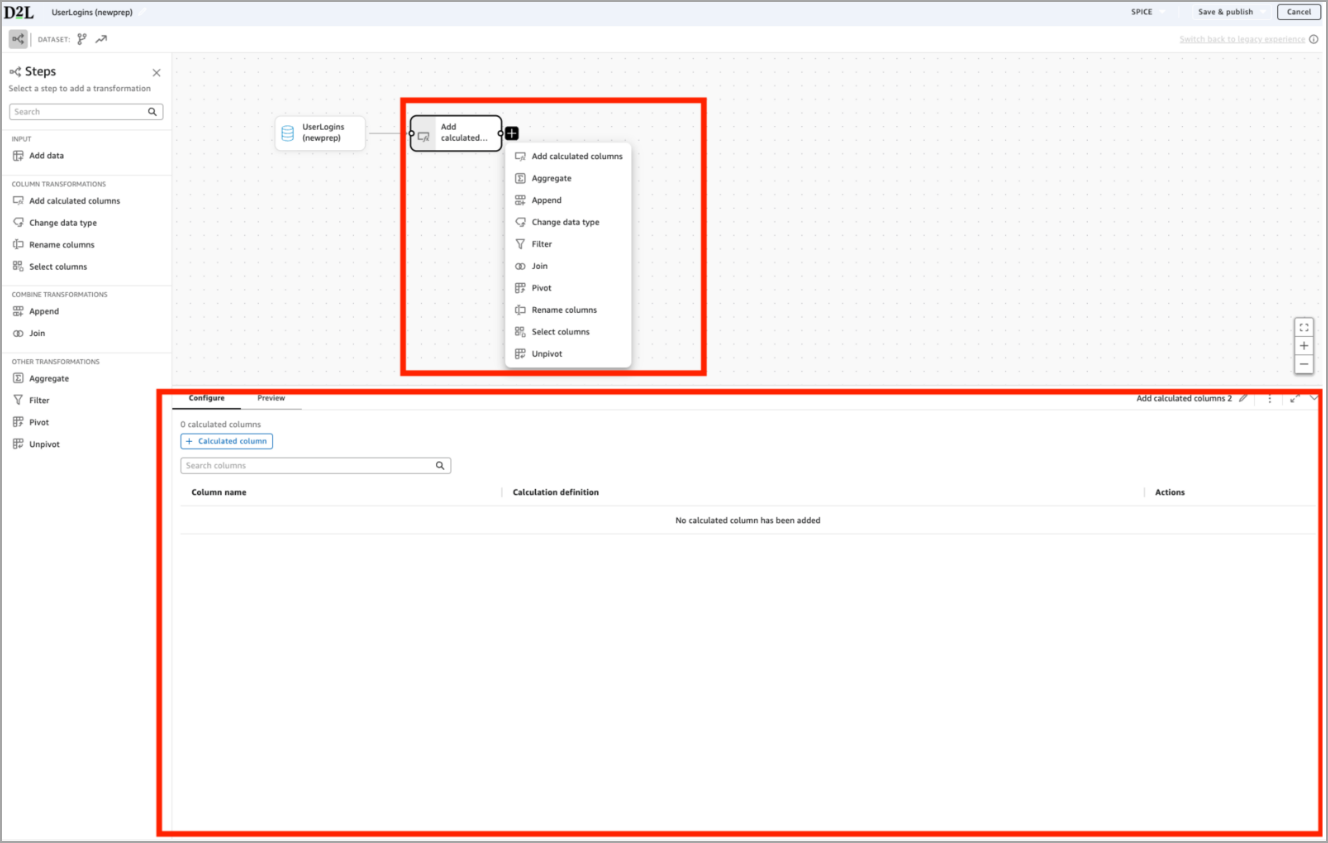
- From the left pane, click Calculated columns. You can also click the + icon on the canvas and choose Calculated columns.
- In the Configure panel below, click + Calculated column.
- Use the formula editor to name the new column and build an expression using fields, parameters, and supported functions.
- Use the Preview panel to confirm that the new column appears and behaves as expected.
Calculated columns is supported in both SPICE and DirectQuery.
Join
Watch this video to learn how to use the Join transformation in Analytics Builder. Review the written steps below.
Use Join when you want to combine two tables based on matching values to bring related information together into a single dataset.
In the example below, the author joins the Sections branch with the Offer & Parent branch using SectionId = orgunitid.
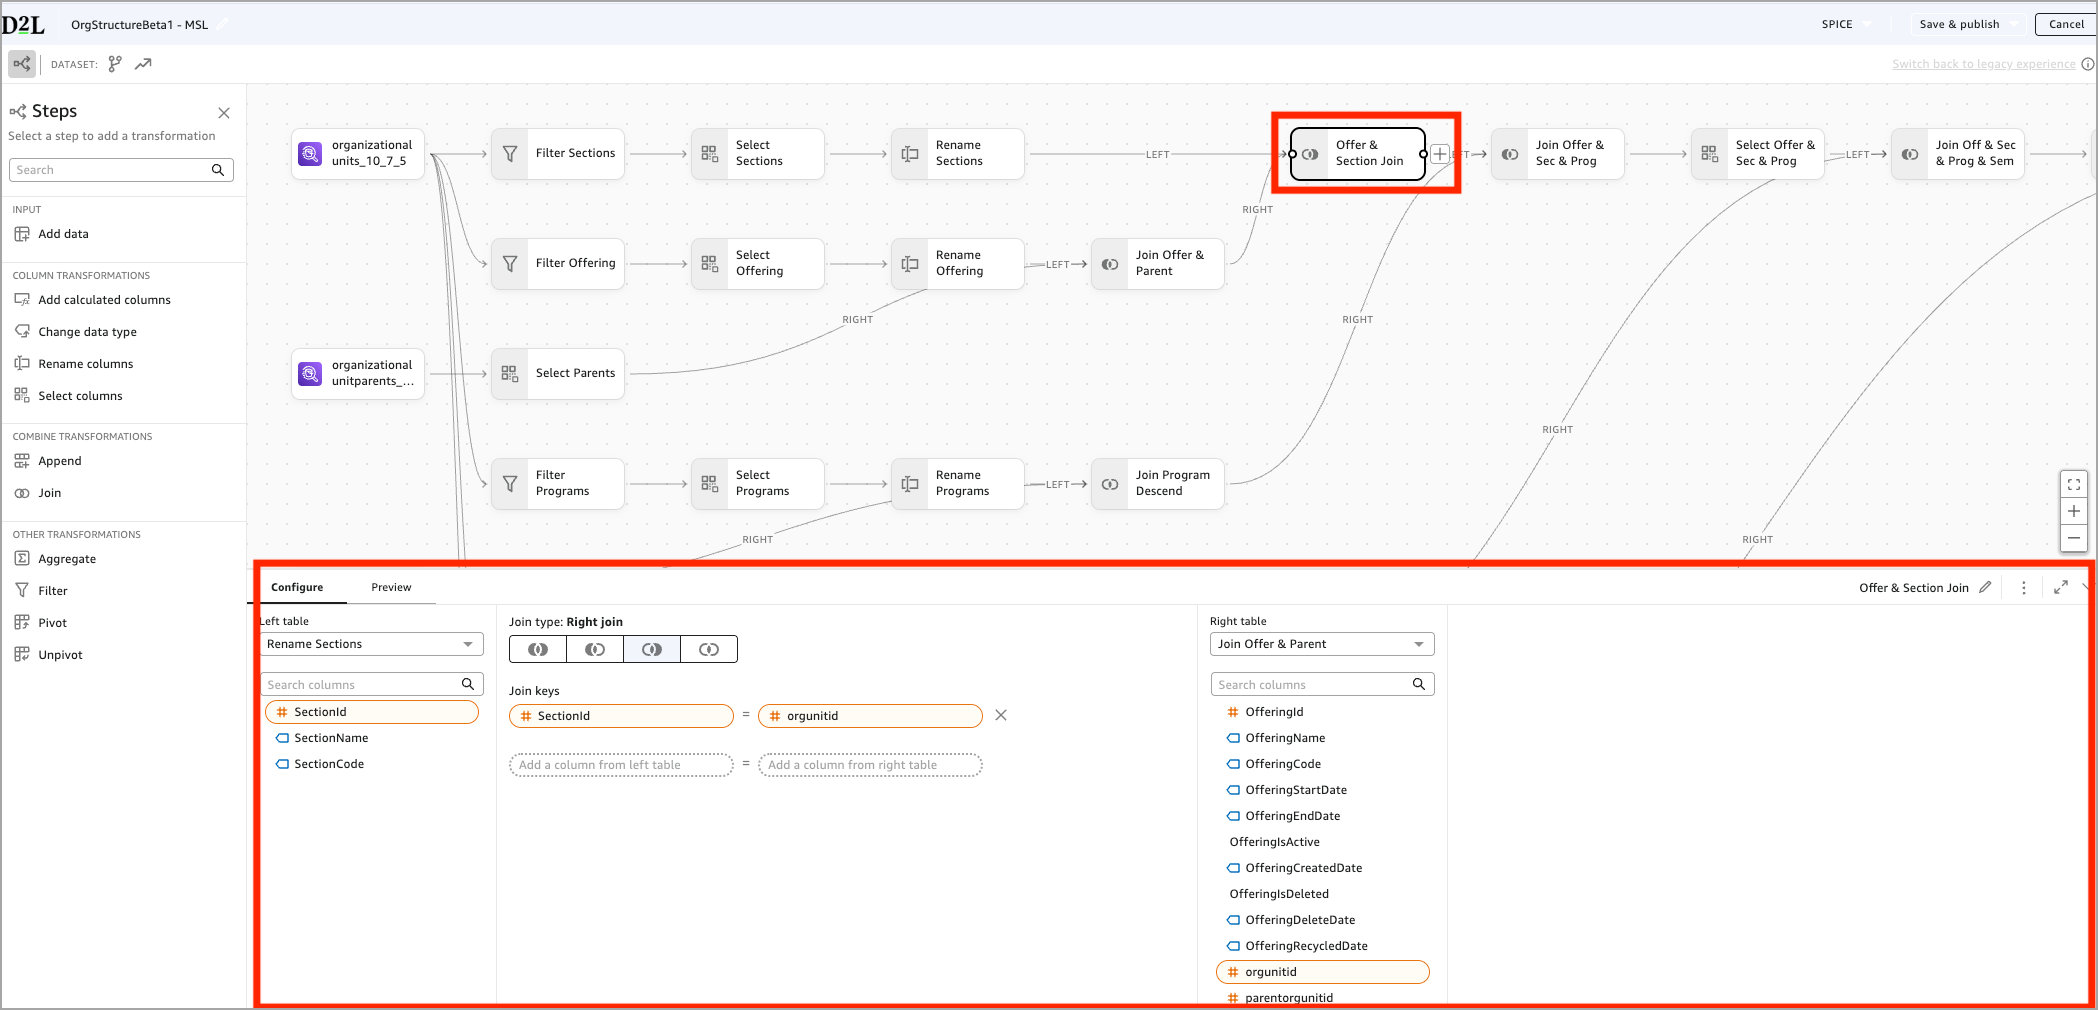
- From the left pane, click Join. You can also click the + icon on the canvas and choose Join.
- In the Configure panel below, select a column from the Left table.
- Select a matching column from the Right table and add more clauses if needed.
- Select a Join type:
- Use the Preview panel to verify that the Join behaves as expected.
DirectQuery supports simple joins only. SPICE supports all join types and multi-step joins.
Append
Watch this video to learn how to use the Append transformation to combine datasets in Analytics Builder. Review the written steps below.
Use Append to combine two datasets at a time by stacking their rows into a single output. If you need to combine more than two datasets, you can Append additional steps to include each dataset sequentially.
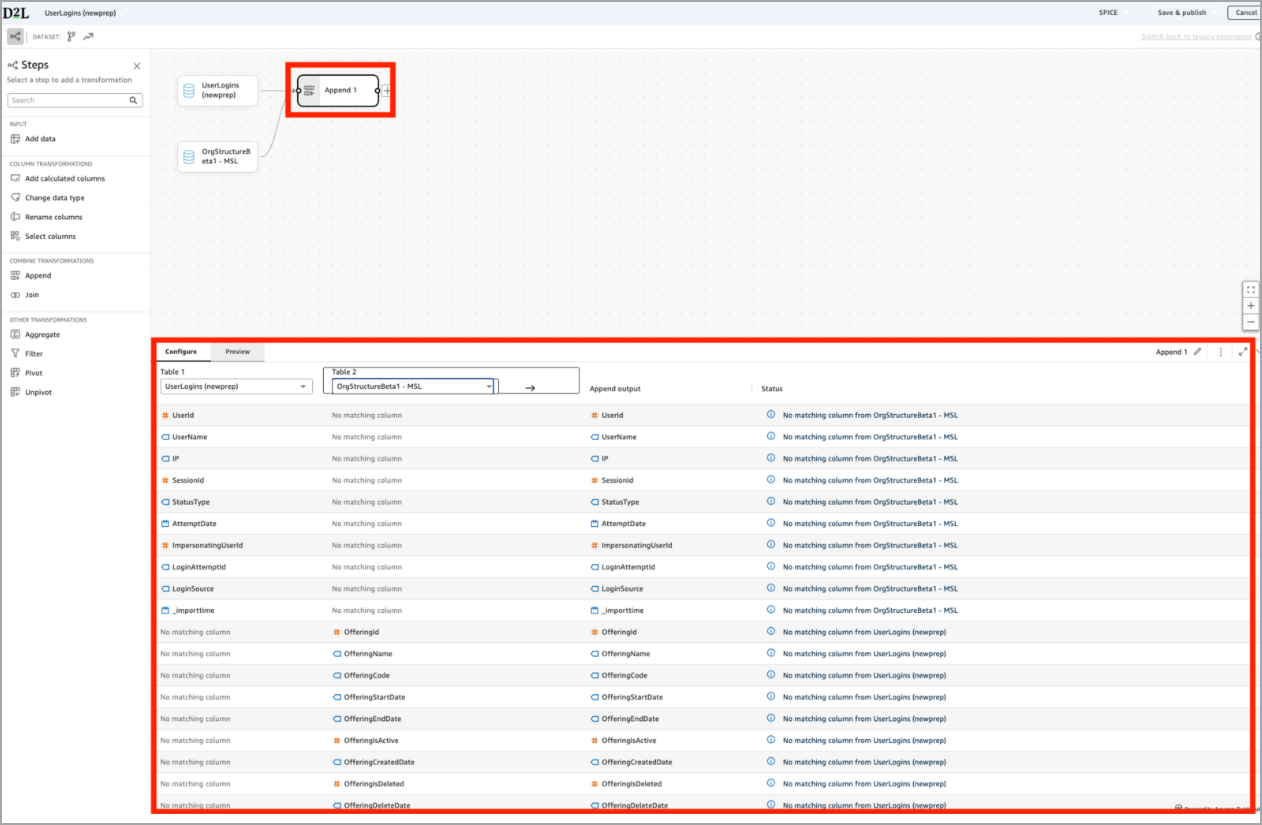
- From the left pane, click Append. You can also click the + icon on the canvas and choose Append.
- In the Configure panel below, select Table 1 (the first dataset) and Table 2 (the dataset you want to append).
- Review the Append Output preview to confirm:
- Matching columns
- Columns that exist only in one dataset
- Column alignment
- Adjust your source datasets by renaming or selecting columns as needed to ensure the structures match.
- Use the Preview panel to verify the rows have been combined correctly.
Append is a SPICE-only transformation. If you add an Append step, the dataset automatically becomes SPICE-only and you will no longer be able to switch to DirectQuery.
Aggregate
Watch this video to learn how to use the Aggregate, Pivot, and Join transformations to summarize data in the New Data Preparation Experience. Review the written steps below.
Use Aggregate when you want to summarize your data. For example, counting records, finding min/max values, or grouping values to produce a higher-level result. In the example below, the author groups by UserName and aggregates StatusType using the Max function to produce a single status value per user.
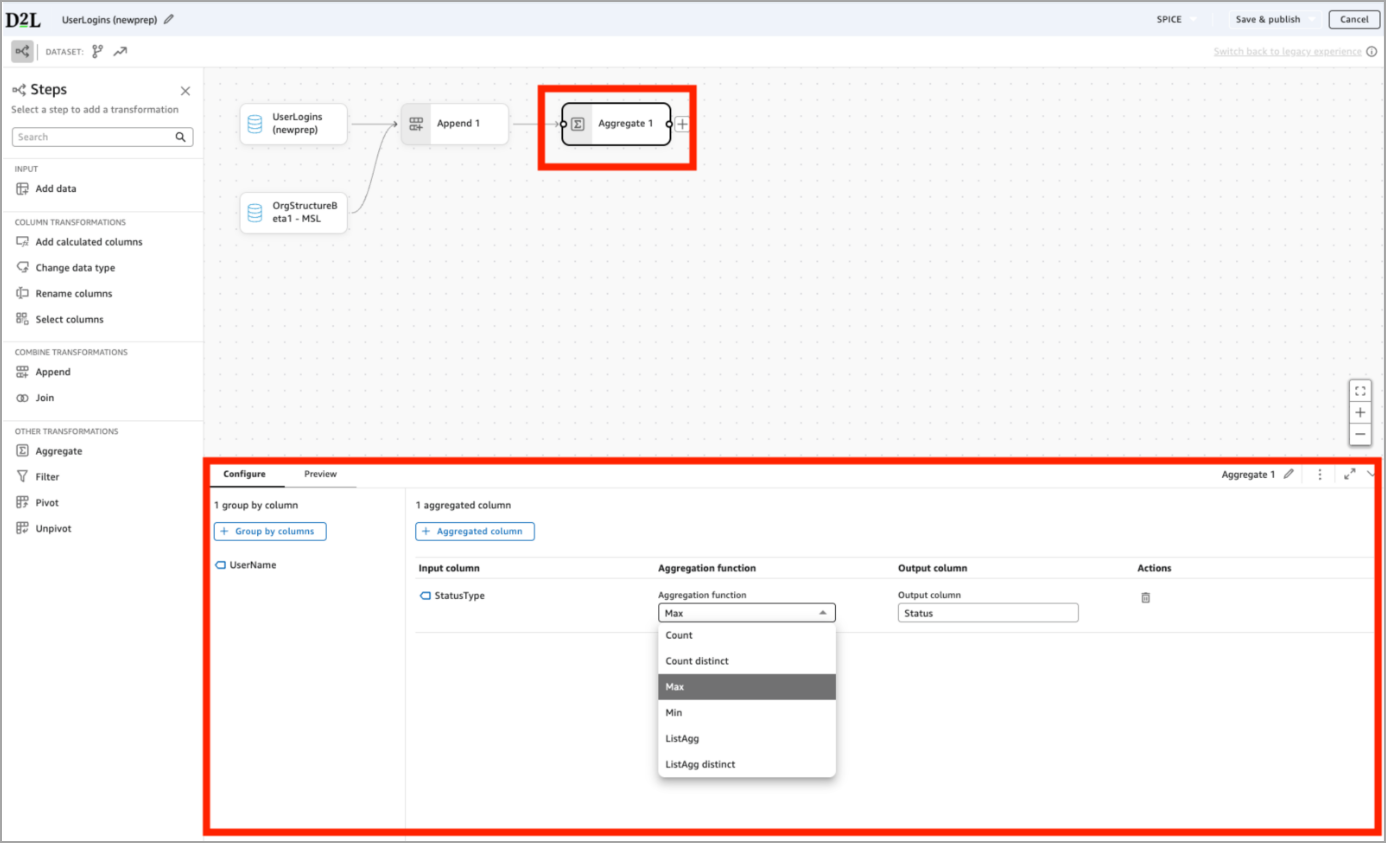
- From the left pane, click Aggregate. You can also click the + icon on the canvas and choose Aggregate.
- In the Configure panel below:
- Add one or more Group by columns (for example, UserName).
- Add one or more Aggregated columns (for example, StatusType).
- Choose an aggregation function such as Count, Count Distinct, Min, Max, or ListAgg.
- Provide an output column name.
- Use the Preview panel to verify the summarized result.
Aggregate is a SPICE-only transformation. If you add an Aggregate step, the dataset automatically becomes SPICE-only and you will no longer be able to switch to DirectQuery.
Pivot and Unpivot
Watch this video to learn how to use the Unpivot transformation in Analytics Builder. For the Pivot transformation, refer to the video located in the Common Transformations section. Review the written steps below.
Use Pivot and Unpivot to reshape data between row-based and column-based formats. These transformations are often used when preparing datasets for analysis or when working with attribute-style data.
- Pivot converts row values into columns.
- Unpivot converts columns into rows.
- From the left pane, click Pivot. You can also click the + icon on the canvas and choose Pivot.
- In the Configure panel below:
- Under Pivot column, select the column whose values will become new column headers.
- Under Value column, select the column that contains the values to populate the pivoted columns.
- Under Aggregation function, choose how multiple values are handled.
- Under Group by columns, select one or more columns to define each output row.
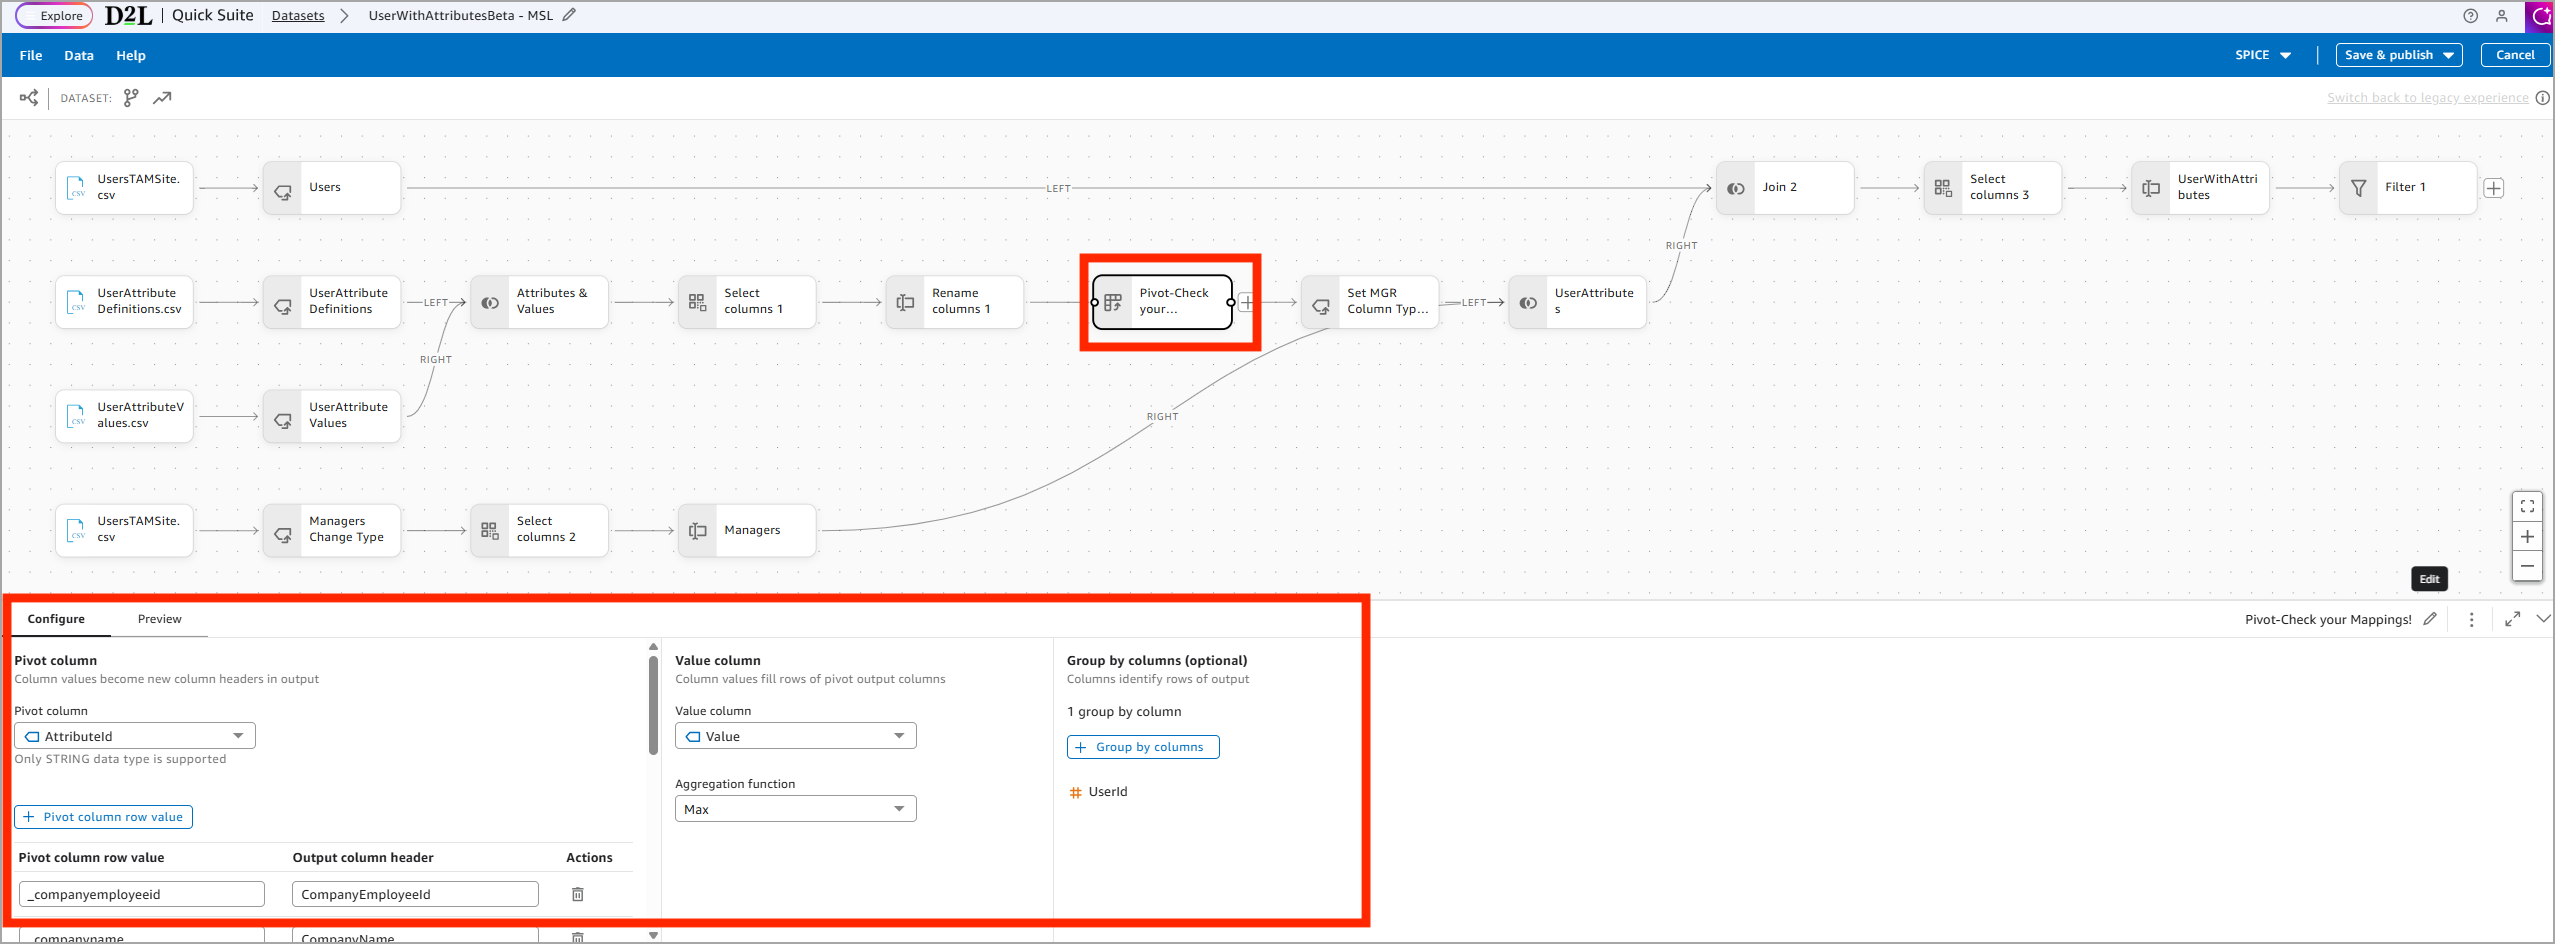
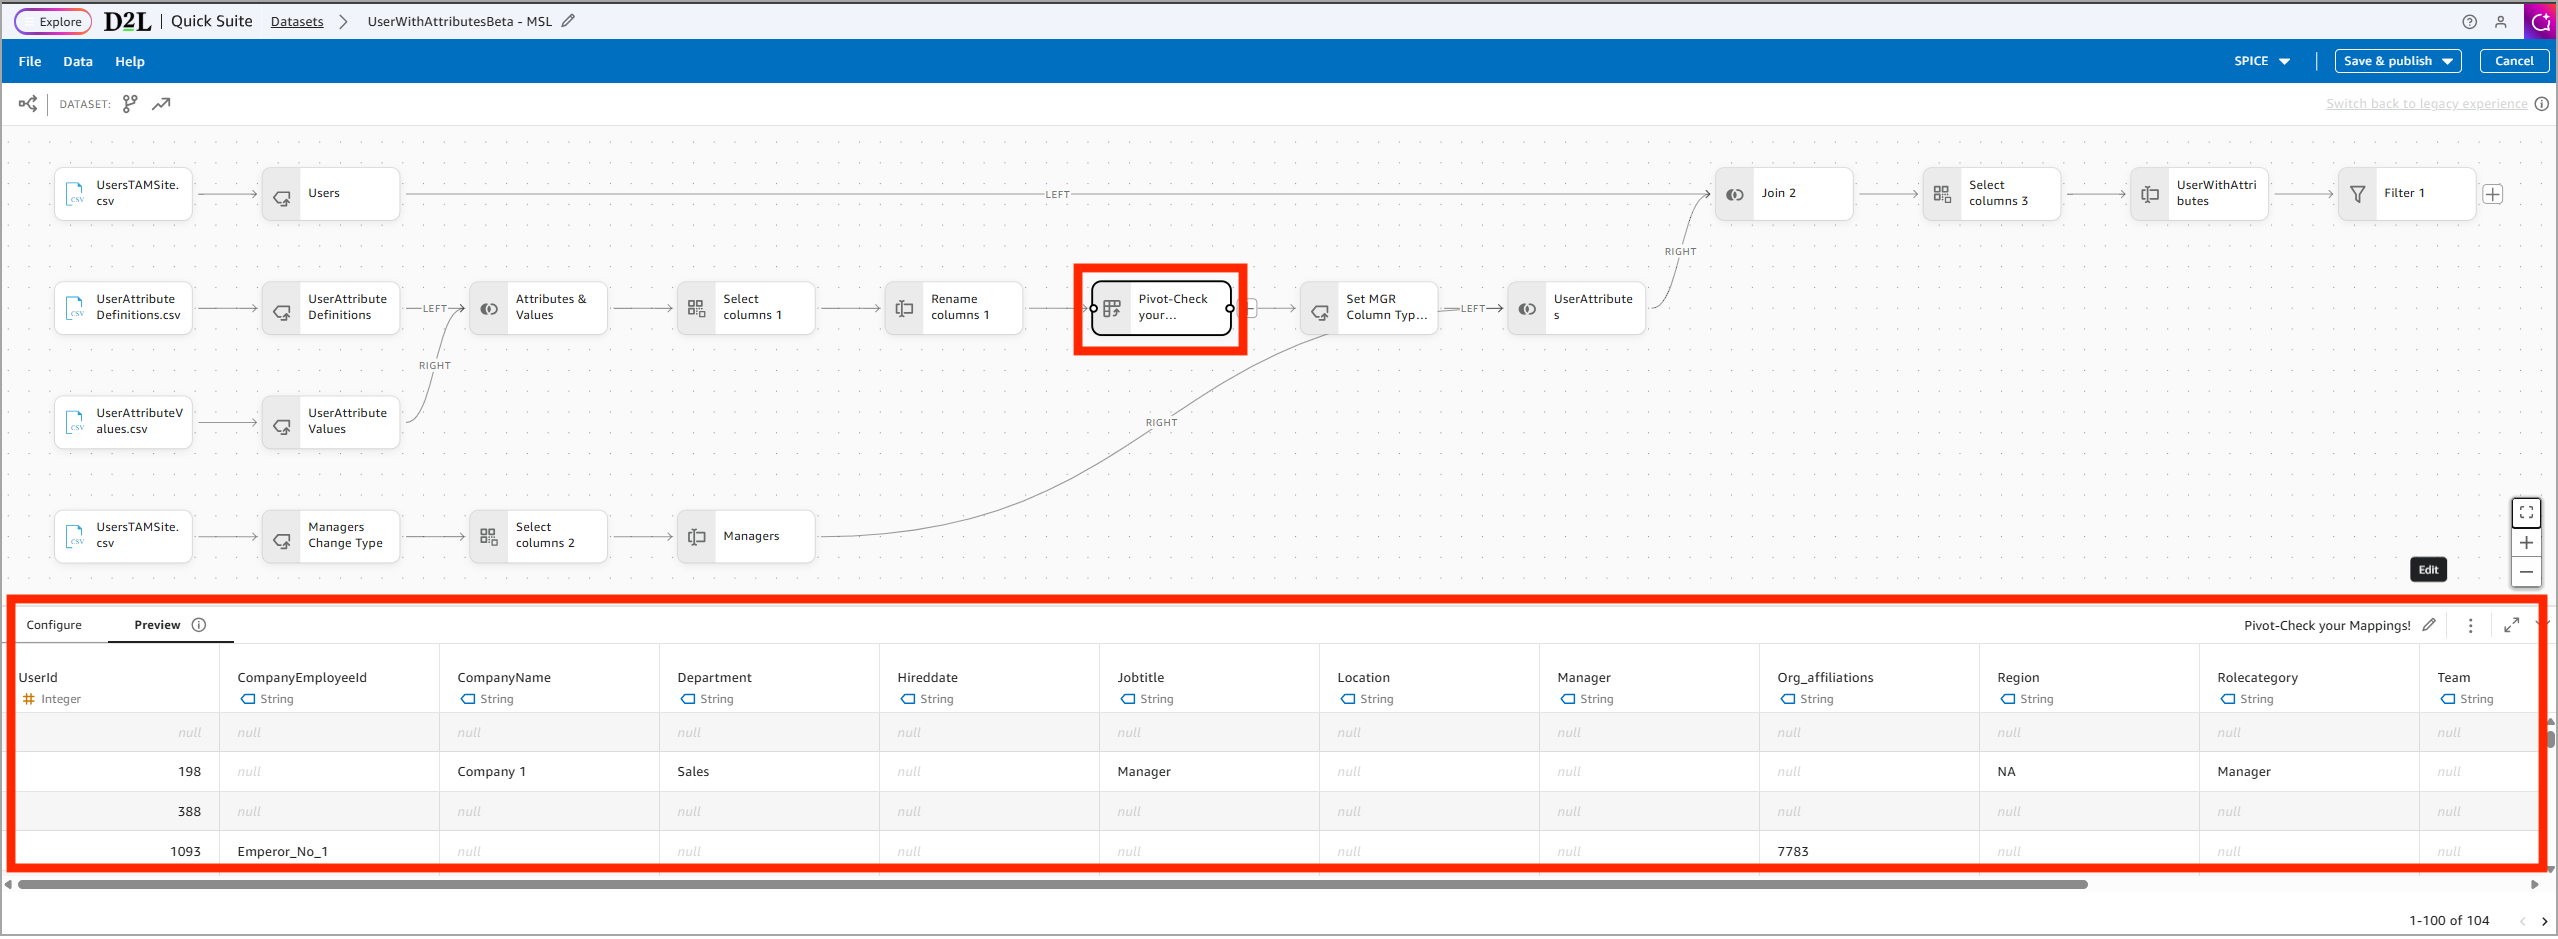
- Use the Preview panel to confirm that rows have been converted into columns as expected.
Pivot and Unpivot are supported in SPICE only.
Advanced capabilities
Divergence
Watch this video to learn how to use Divergence in Analytics Builders. Review the written steps below.
The new Data Preparation Experience allows you to split your workflow into parallel branches, each applying its own transformations before merging back together. This is helpful when different parts of your dataset require separate logic.
In the example above, the Organizational Units dataset branches into parallel paths for:
- Sections
- Offerings
- Programs
- Semesters
- Departments
This makes it easier to build hierarchies such as program → semester → section or other multi-level organizational structures.
Divergence is only supported in SPICE. DirectQuery can't support multi-branch workflows.
Composite datasets
Watch this video to learn how to use composite datasets in Analytics Builders.
After you build an organizational structure dataset, you can add it to any report you create. You do this by using the custom dataset as a data source for a new dataset. Composite datasets in Analytics Builder allow you to reuse custom data across multiple reports, save time, and ensure consistent results.
Switch between experiences
Watch this video to learn how to switch between experiences in Analytics Builder.
Datasets created in the legacy data preparation experience can never be converted to the new experience because they use a different internal structure that is not compatible with the new visual workflow editor. Authors must rebuild their legacy datasets manually in the new experience.
To convert a dataset from the New Data Preparation experience to the legacy experience
- Create a new dataset. It automatically opens in the New Data Preparation experience.
- Click the Switch back to legacy experience opt-out link in the top right of the interface, below the toolbar.
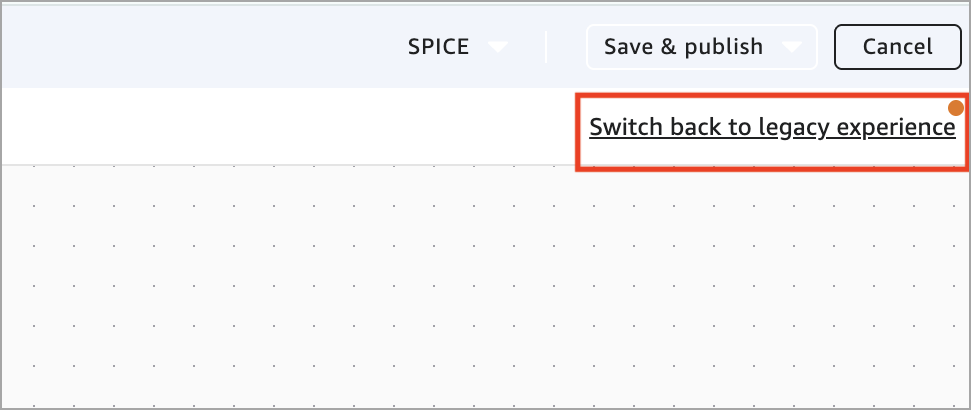
- Your new dataset reopens in the legacy data preparation workflow.
You may switch back and forth between experiences until the dataset is saved. After you save or publish the dataset in the new experience:
- The opt-out link disappears.
- All future edits open in the new experience.
- The dataset can't be converted back to the legacy interface.
If you prefer to continue using the legacy experience, you can create a new dataset and start over, or duplicate an existing dataset that was originally created in the legacy editor.
FAQ
Why are some datasets greyed out when I try to add them in the New Data Preparation experience?
Datasets can only be combined when they were created in the same experience. This means:
- Legacy parent datasets can only be used by child datasets also built in the legacy experience.
- New Data Preparation experience datasets can only be used together with other New Data Preparation experience datasets.