You can use the Reports module to build customizable reports from sales and learner data available within the Reporting Layer. The Reporting Layer has advanced and flexible reporting functionality. For example, you can create course attendance reports or specific product reports. These reports can be exported as CSV or PDF files. Charts (Pie, Bar, Line, etc.) can be included in these custom reports. A report can also be scheduled to run at set intervals with the results sent to a set of people.
Open the Learning menu and select Reports.
Reports Table
When you enter the Reports module, you can review a table of existing reports.

Figure: View details for reports on the Reports page.
The following Bulk Actions are available for records in the Reports table:
- Mass Update - Updates multiple selected records together. D2L advises against using the mass update function on these records due to their integral connections with other records. Updating these records may result in inconsistencies and errors in data representation across various system components.
- Merge - Merges multiple selected records. D2L advises against using the merge function on these records due to their integral connections with other records. Merging these records may result in inconsistencies and errors in data representation across various system components.
- Export - Generates a CSV export of all selected fields.
- Delete - Deletes all selected records. D2L advises against deleting these records due to their integral connections with other records. Deleting these records may result in inconsistencies and errors in data representation across various system components.
For more information about interacting with records tables, refer to Tips and Tricks.
Report Record
You can review the content of a report by clicking on the Name of the report in the records table.
The following Actions are available for Course Sale records:
- Edit - Opens the record in editing mode.
- Duplicate - Creates a duplicate of the report and opens the editing screen.
- Delete - Deletes the selected report.
- Export - Downloads the report as a CSV file
- Download PDF - Downloads the report as a PDF file
- Add to Target List - Not in use.
- View Change Log - Not in use.
To edit an individual data field, double-click the pencil icon (✏) inside the field, make your changes, then click the checkmark (✔) to save your changes.
To move between records, use the Previous and Next buttons in the top-right corner.
Report Data Fields
The following data fields are at the top of the record in the Basic tab:
- Name - The name entered when the report was created.
- Assigned to - User that the report was assigned to. This doesn't have any effect on who can access the report.
- Date Created - Date the report was created.
- Date Modified - Date the report was last edited or modified.
- Description - Not in use.
Report Building Example
There is an example of building a report that allows an admin to query the system to check the number of Licenses purchased for each course within a specific time frame.
- Open the Learning menu and select Reports.

Figure: Click the Learning drop-down menu and select Reports.
- Click Create Report.

Figure: Click Create Report on the Reports page.
- Name the report. For example, "Product Licenses Report".
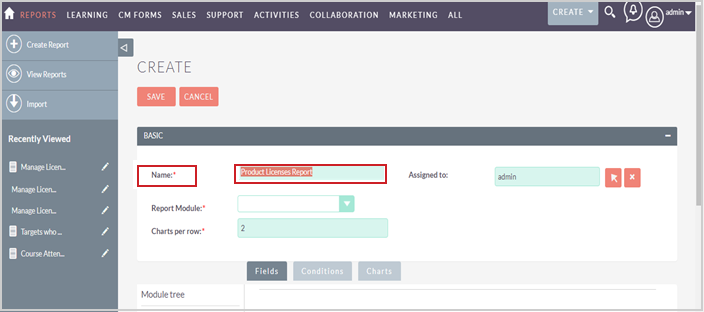
Figure: Enter a Name for the new report.
- Choose a module to work with. If you want to build a report related to the number of licenses bought for each product, the corresponding module is Course Sale Item. Once you select Course Sale Item from the Report Module list, note how it appears at the top of the module tree and how its fields appear in the fields box.
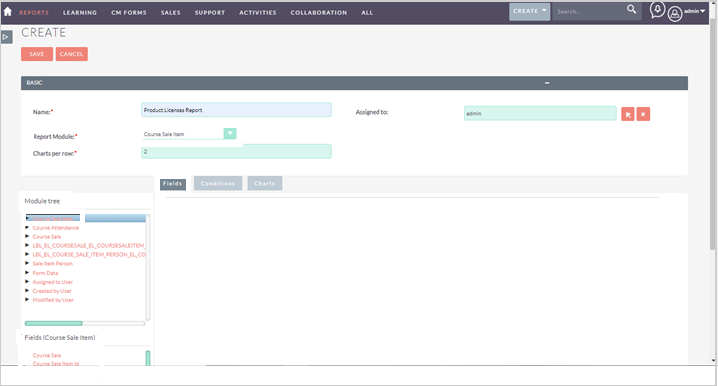
Figure: Select a module to create a report.
-
Select the fields you want to include in the report. You can do this by single-clicking on the desired fields or by dragging and dropping them into place.
- Order Date
- Order Number
- Invoice Name
- Invoice Company
- Description
- Licenses Purchased
- Licenses Claimed
- Licenses Remaining
Your workspace should look similar to this by now:
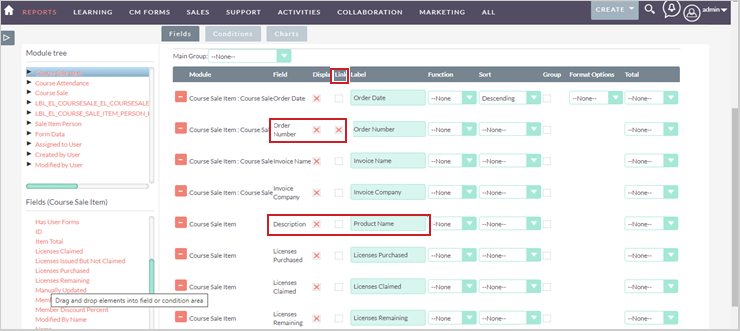
Figure: Choose the fields to appear in the report.
It is useful to create links within the report. Select the Link checkbox to enable this. In the example above, Order Number is linked to allow an instant link to the Course Sale record if required.
You can also customize the display labels. In the example above, Description was changed to Product Name.
- Click Save. This has the effect of both saving and immediately running the report. You should see some data displayed if you have Course Sale Item data in your Reporting Layer.
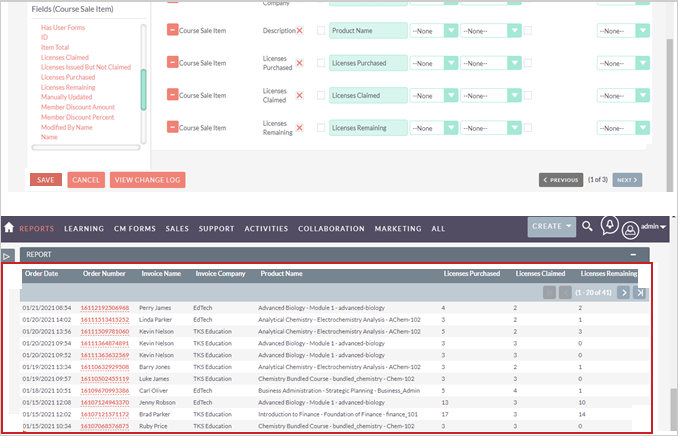
Figure: Click Save to add the new report to the Report list.
- Allow the data reported on to be subject to a Date parameter. Click Edit to return to the editing screen. The Conditions button is across the top of the fields. To have another empty workspace, click it.
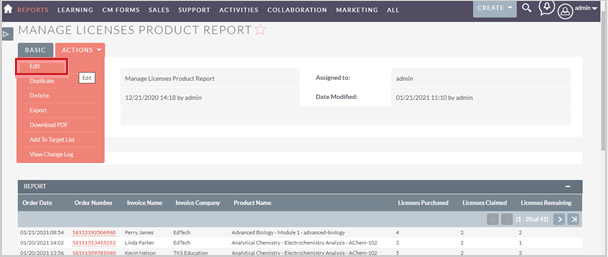
Figure: Click the Actions drop-down menu and select Edit.
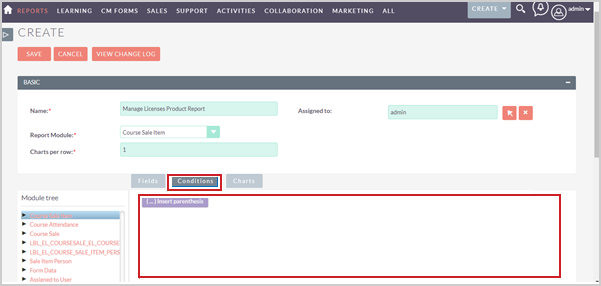
Figure: Click Conditions to generate a text box.
- Choose the fields that determine the display conditions in the same way you did in previous steps. For example, Has Licenses and Order Date to get the number of licenses purchased for each course from the beginning of the month of January.

Figure: Choose the fields to determine a report's display conditions.
- Click Save again to run the report. If no data is displayed, use the Calendar icon to choose a date you know a sale was made on your system. Sales on this date should then appear. If you use Greater Than as the operator and set that date as the first of January, then all sales since that date should appear, as in the example below:
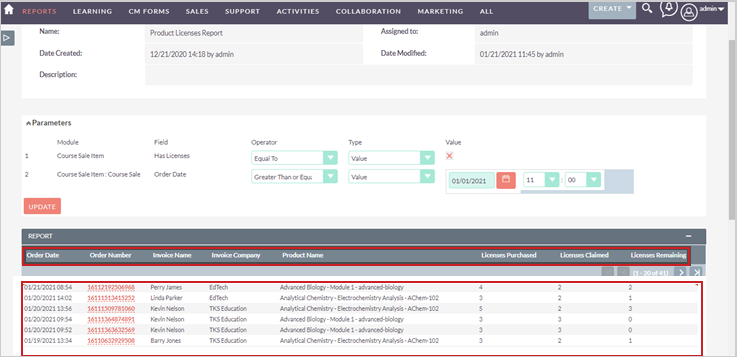
Figure: Click Save to view the report in the Report table.
Add a Chart
You can include charts such as pie, bar, line, and radar in your custom reports. To do so, click Edit to return to the editing screen. The Charts button is across the top of the fields list. To have another empty workspace, click it.
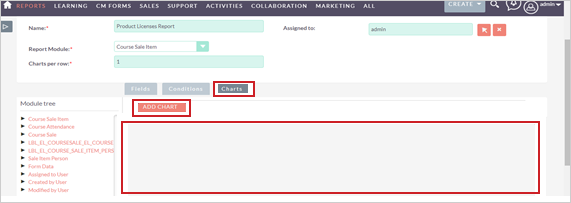
Figure: Click Charts > Add Chart to create a chart in a custom report.
Then click Add Chart to start making your own chart. After naming your chart, select the type of chart you would like and add the data you want in the X and Y axis. In the example below, a Grouped bar was selected as the Type of chart, and Product Name and Licenses Purchased as the data to appear are in the X and Y axis.
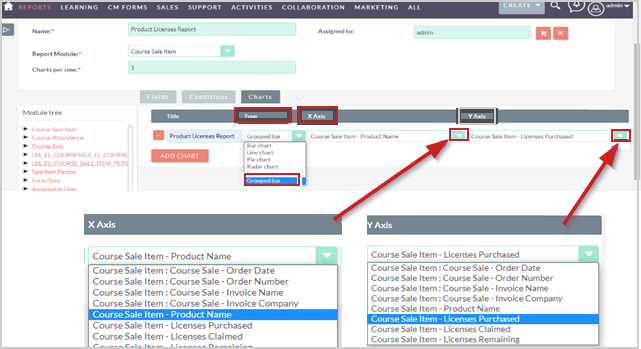
Figure: Modify the X and Y axis for a chart.
When you finish adding a chart to your report, click Save. The report runs again and includes the newly-added chart as shown in the example below.
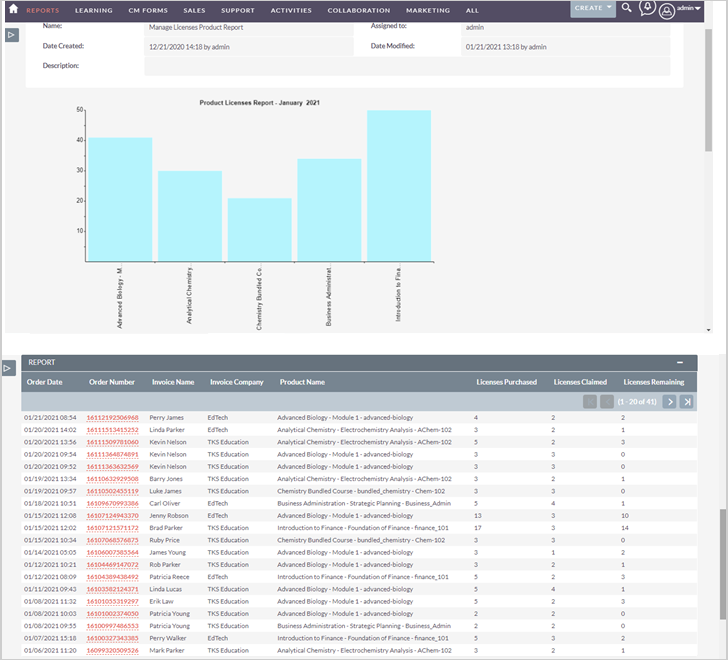
Figure: Click Save to view the chart in the report.
Schedule Reports
You can schedule reports to run automatically at selected intervals and have the results emailed to selected people. To create Scheduled Reports, scroll down to the bottom of the Report you already created. Click Create in the Scheduled Reports sub-panel.
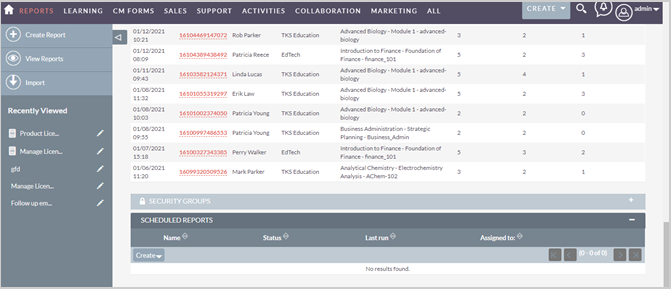
Figure: Click Create in the Scheduled Reports sub-panel.
This opens the Short Form Scheduled Report creator. Short Form is a subset of the Full Form. Any display options work in the same way. Click Full Form to access all the options.

Figure: Click Full Form to access all Scheduled Reports options.
Once you open the Full Form, you can check a number of input fields, such as Schedule and Email Recipients, that need to be completed. When you have set up your Scheduled Report, click Save.
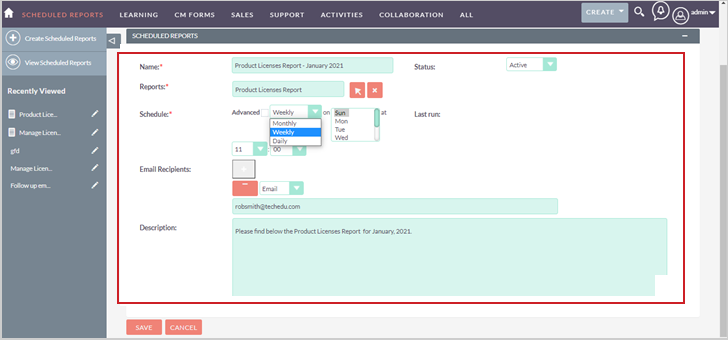
Figure: The input fields appear in the Scheduled Reports section.
The following are input fields:
- Name - The name of the scheduled report.
- Reports - The report that runs on the schedule. This will already be populated when you create a scheduled report from a sub-panel.
- Schedule - You can set how often the report runs and at what time. There are two options: Advanced and Normal.
- Drop-down - You can select between running the report Monthly, Weekly, or Daily.
- For Monthly, you can select a day of the month from the list. Press and hold the Ctrl key while you click to select multiple days. Then select a time from the drop-down menus. The first box is for hours (using a 24-hour clock); the second one is for minutes.
- For Weekly, you can select days of the week from the list. Press and hold the Ctrl key while you click to select multiple days. Then select a time from the drop-down menus. The first box is for hours (using a 24-hour clock); the second one is for minutes.
- For Daily, select the time from the drop-down menus. The first box is for hours (using a 24-hour clock); the second one is for minutes.
The following are the Advanced Schedule Options:
- Min - The minute past the hour to run the report.
- Hour - The hour to run the report using a 24-hour clock.
- Day - The day of the month to run the report.
- Month - The month to run the report, for example, "4" for April.
- DOW - Run the report on a day of the week, for example, Monday is "1".
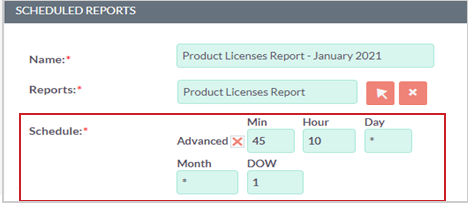
Figure: Enter the date and time in the Schedule field.
Note: With the Advanced Schedule Options, you can use the * operator to represent "all" or "any". In the example above, the report will run every Monday at 10:45 am.