
|
Important: This document describes workflows in the legacy Analytics Builder experience. Datasets created before the release of the new Data Preparation Experience in January 2026 will continue to use these workflows. Datasets created after January 2026 will use new Data Preparation Experience workflows, which are documented in Author workflows in the New Data Preparation Experience for Analytics Builder. |
Analytics Builder enables you to create reports by combining assets in a way that provides the business intelligence information you need. You can use existing Brightspace Data Sets, related assets (such as previous analyses) or combinations thereof. At a high level, you add the Brightspace Data Set (BDS) assets to your report and join them as appropriate. You can then manipulate the data to get the targeted report you want by refining the information by removing columns you don't need or filtering out unwanted content.
To help you get started, the following default templates are available:
- Discussion Engagement
- Brightspace Logins
- Course Enrollment Activity
- Course Content Visits Counts and Total Time
- Assignment Submissions Statistics
- Month over Month Course Access
- Session Counts by Role
- Assignment Submission Status
- User Activity Achievement
- Final Calculated Grades
- Competencies Alignment
- Quiz Question Attempts
|
Important: If you edit data within a dataset that is included in another custom report, the changes you make propagate throughout all instances of that dataset. |
Building custom reports and dashboards
To create a new report using Analytics Builder:
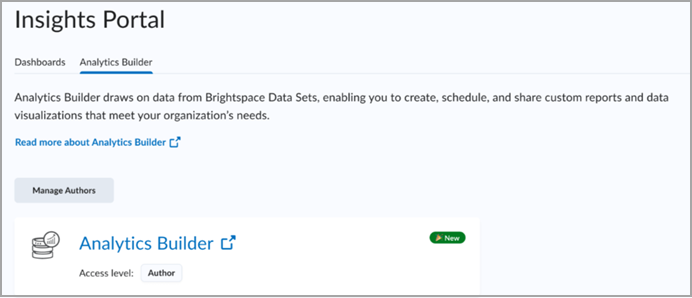
- Navigate to the Insights Portal.
- Under the Analytics Builder tab, click Analytics Builder. Analytics Builder opens in the Analysis tab by default. From this view you can also see the Favorites, Recent, My Folder, Shared Folders, Dashboards, and Datasets tabs.
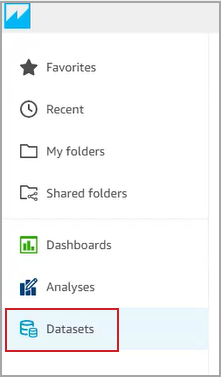
- Click the Datasets tab to show the list of available assets.
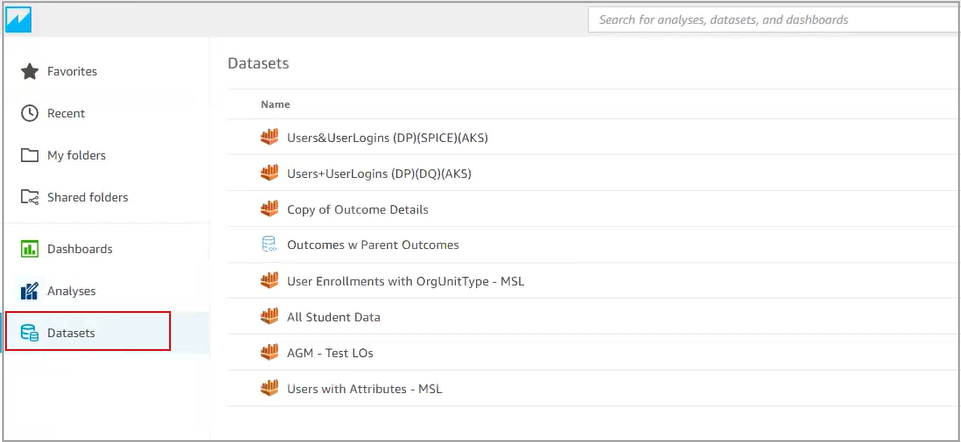
- Click the asset you want to use. You can scroll through the list or use the search bar at the top of the page to find the required asset.
- On the Dataset properties page, the Summary tab opens by default. You can also see the Permissions and Usage tabs, and additional tabs will appear once the Dataset is in use such as in a Custom Dataset, Analyses, or Dashboard.
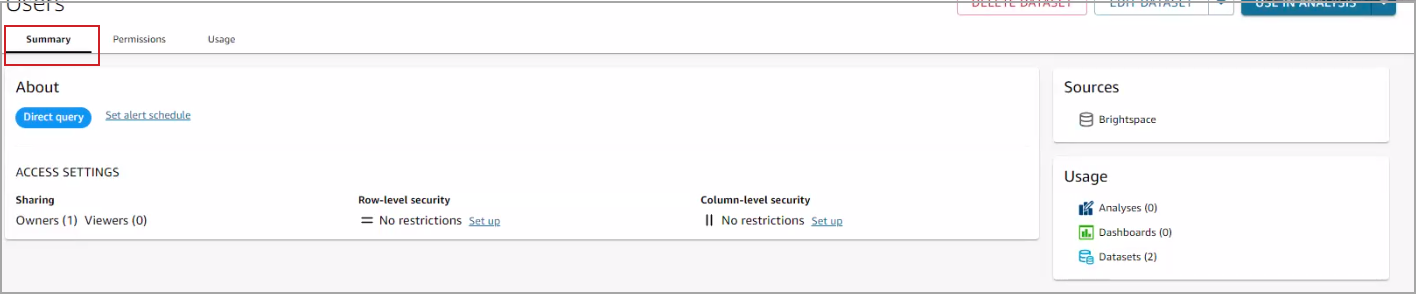
- Click the More Actions menu for Use In Analysis at the top of the page, then click Use In Dataset.
The dataset displays in the Data Prep area with all the columns in the table appearing below the dataset preview area.
- Do any of the following:
- Determine the Query mode you want to use:
- Direct query pulls data directly from the database.
- SPICE (Super-Fast Parallel In-memory Calculation Engine) uses a snapshot of content taken at regular intervals.
For more information, refer to Which Query mode is right for me?
- Click the Filters icon and click Add Filter. For more information, refer to Adding filters to your report.
- To add calculations to a field, do one of the following:
- Click the More Actions (three vertical dots) icon and select Add Calculated Field.
- Click the + icon beside the Fields tab title and select Add Calculated Field.
For more information, refer to Using Calculated Fields.
- Add a name for your report. The name should differentiate it from other similar reports.
Note: It can be helpful to include identifiers in your naming convention. For example, DQ_DP_[AuthorInitials]_[reportTitle] can mean it's a Data Query report created in the Data Prep by the author whose initials are listed.
- Click Publish.
You can join individual assets together to create a chain. There is no limit to the types and number of assets in each dataset in the chain and you can join as many as you require in the Data Prep area. However, there is a limit to the number of times you can reuse an asset in Analytics Builder. If you reach the limit on an asset you want to use, you can use a custom SQL query to get the information you require. For more information, refer to Manipulate fields in your custom datasets using SQL
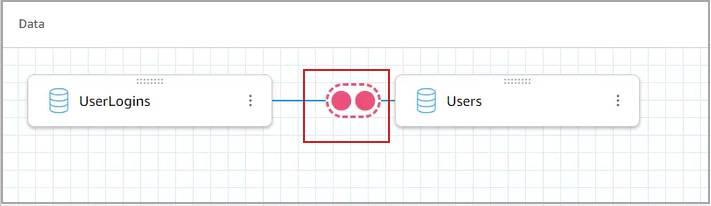
When you include more than one dataset or other asset in your custom report, you must define the join clauses between each set of assets.
To join individual assets
- Click to select the join in the preview.
- Under the Join Configuration area, select the fields that will join the two data assets.
- For each join clause, select the join type (Inner, Left, Right, or Full).
Note: You can hover over each option to read a description of the type.
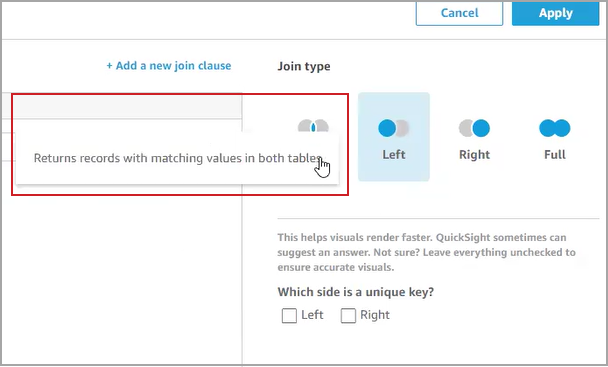
- Indicate which data asset contains the unique key, if applicable.
It is not necessary to select a unique key to configure your join clause.
- If you want to include additional clauses, click Add a new join clause, and complete the workflow for each.
- When you have added all the necessary join clauses, click Apply.
The Brightspace Datasets (BDS) contain raw, user-level data from Brightspace that is available in Data Hub. Those datasets and other custom-made reports (created by customers) are available as source for your new custom report. However, it is likely that the existing reports contain columns and data points that are not relevant to your needs. In the Data Prep area, you can specifically include or exclude fields to ensure that your report targets exactly the analytics you require.
Removing specific fields from your custom dataset
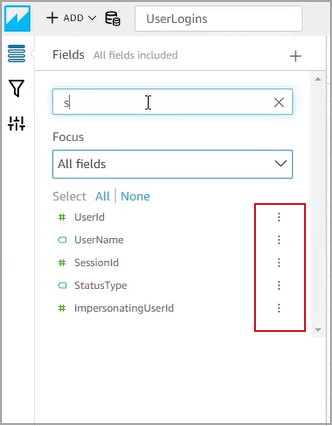
- Search for fields you want to remove from the dataset.
- From the search results, click the More Actions (three vertical dots) icon to the right of the field name and select Remove Field.
Bulk removing multiple fields from your custom data set
- Search for fields you want to remove from the data set.
- Click and drag your cursor to highlight a block of fields in the query results.
- Click the More Actions (three vertical dots) icon to the right of one of the results, and select Exclude Fields.
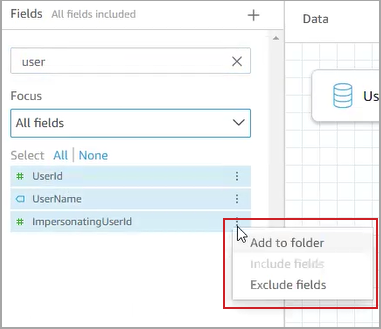
Figure: The bulk action applies to all the highlighted fields.
Including fields you have previously excluded
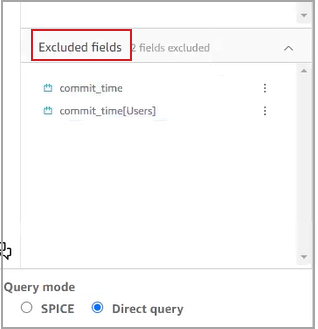
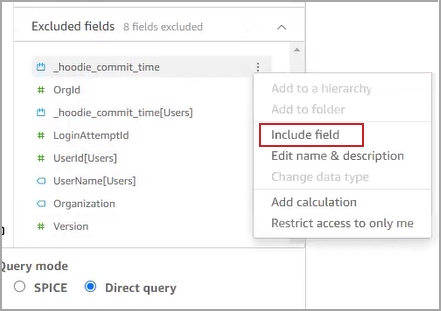
- In the Excluded fields list, browse to the field you want to include.
- Click the More Actions (three vertical dots) icon to the right of the field name and select Include Field.
You can use filters to remove specific data points. Consider the following scenario: You have a monitoring account that runs in the background, but the activity of that account does not contribute meaningful data to your report. You could filter by UserName to remove the monitoring account from the report. This is just one example of how you can use filters to help you focus the information on your report.
To filter an account out of the report:
- Click the Filter icon and select UserName from the query results. By default, fields are set to include all.
- Under Filter Type, do one of the following
- To filter by a specific value, choose Custom filter.
- To filter by individual items, choose Custom filter list.
Select the Filter Condition (such as equals, does not equal, starts with, ends with, contains, does not contain, and so on).
Click Use parameters, if applicable.
List the values you want to filter by; one on each line.
Click Apply.
You can add Calculated Fields to provide a space to create formulas for your custom report.
- To add calculations to a field, do one of the following
- Click the More Actions (three vertical dots) icon and select Add Calculated Field.
- Click the + icon beside the Fields tab title and select Add Calculated Field.
- In the formula space, enter a meaningful name in the Add name field.
- In the Fields list, select the fields you want to use in your calculation.
- In the Functions list, double-click to select the functions you intend to use.
There is definition and syntax information available below the functions list. Learn more provides additional information about the function you select.
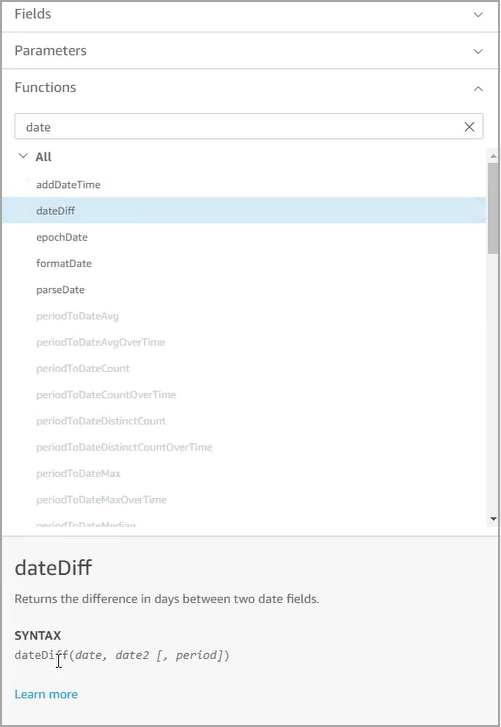
- Click Save.
The power of using Analytics Builder comes from being able to include exactly the data points you want and have them interact to produce a very specific result. Scripting a SQL query enables you to interact with existing data sets; however, it avoids the usage limitations imposed by chaining together datasets using the Data Prep method.
To create a report using a SQL query
- In the top right corner of the Analytics Builder interface, click New Dataset.
- In the Create a Dataset area, click Brightspace to indicate the database you want to use to script the query.
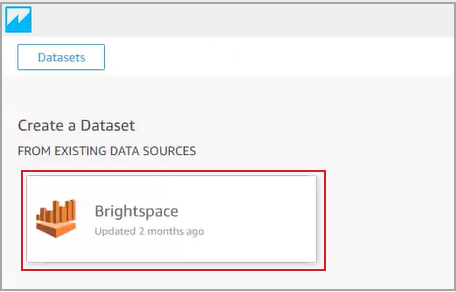
- Click Create Dataset to open the Choose your table dialog.
- Click Use custom SQL.
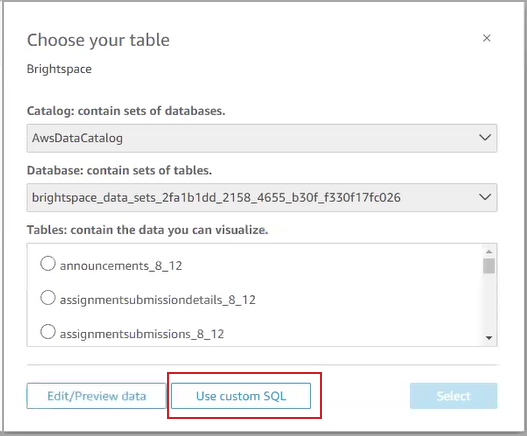
- On the Enter custom SQL query dialog, click Edit/Preview Data. A text editor opens where you can script or paste previously written SQL query code.
- Add a title for your query in the Custom SQL Name field and ensure the same name appears for your custom dataset.
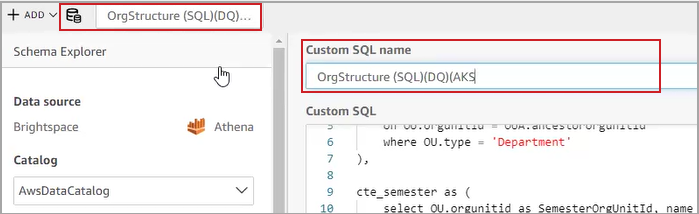
- Enter your code in the Custom SQL field.
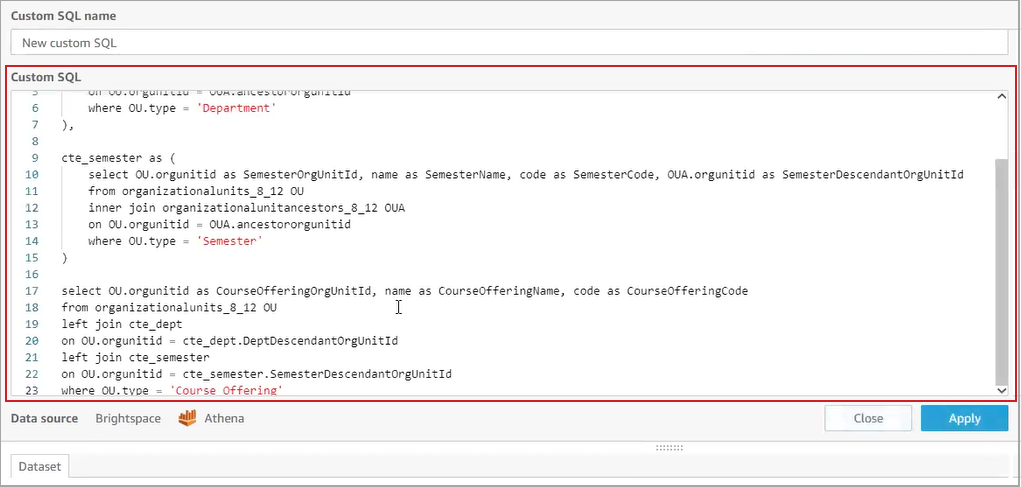
- Click Apply.
Use row-level and column-level security with Analytics Builder
To create datasets that are useful and relevant to report consumers, you can limit rows and columns available to specific users. This is not mandatory but can assist in distributing and protecting specific data points in your reports.
- Row-level security enables you to grant permissions so that instructors can see only the courses they instruct. An administrator or department head may share a dashboard to multiple instructors. Each instructor can view the same dashboard, but the content each can see is limited to their specific courses; they cannot see content from courses they do not teach.
- Column-level security enables you to secure columns within the dataset that should not be widely viewed. For example, in the interests of protecting Personally Identifiable Information (PII) or preserving the anonymization of assignment submissions, an instructor may be limited in seeing last names or user IDs of the learners in their classes.
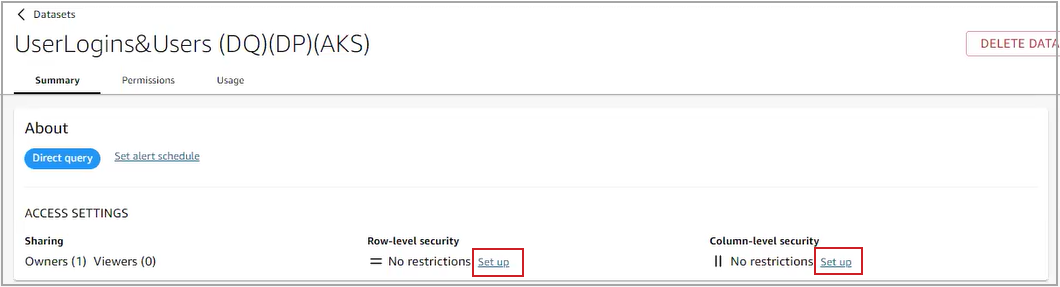
To set row- or column-level security:
- On the Analytics Builder home page, select a dataset.
- On the Dataset properties dialog, click Summary.
- Under About, click Set up
Video: Row- and column-level security in Analytics Builder
Watch this video to learn how to share dashboards with role-based groups. Review the written steps below
Watch this video to learn how to schedule emails with Reports in Analytics Builder in Brightspace.
Authors can share Analytics Builder resources with individual users, or with a group. Sharing with groups improves the scale at which you and other report authors can distribute information from Analytics Builder.
For each organization-level role that has the Analytics Builder > Can Use Analytics Builder permission, Analytics Builder automatically creates a group. The group's name is a combination of the role name and role ID. For example, if you grant the Can Use Analytics Builder permission to the Program Administrator role, whose role ID is 103, the Analytics Builder group name is ProgramAdministrator-103.

|
Note: Group names only support alpha-numeric characters in Latin-based languages. Special characters and whitespace are automatically removed. |
If a user's role changes, that user is automatically moved to the Analytics Builder group that corresponds to their new role. If a role is deleted, the corresponding Analytics Builder group is also deleted. Updates to group membership in Brightspace are expected to appear in Analytics Builder within a day.
|
Note: If a user's role changes in Brightspace, they might also remain a member of the previous group until the next day. At that time, the user is removed from the previous group membership and added to the group appropriate to their new role, as expected. |
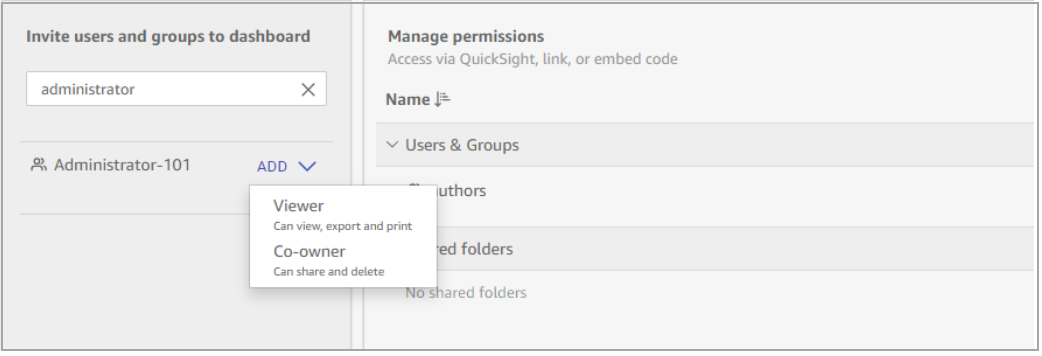
To share a dashboard, analysis, or dataset with a group
- On the Analytics Builder home page, select a dashboard to share.
- In the Permissions tab, click Add Users and Groups.
- Search for the user or group with whom you want to share the resource.
- In the Permissions column, indicate if you want to designate the group as either Viewer or Co-owner.
- Viewer: all members of the group can view, export, and print the shared resource.
- Co-owner: all members of the group can view, export, print, share, and delete the shared resource.
|
Note: If a reader belongs to a group with which an asset is shared as co-owner, the reader continues to be limited by the permissions of being a reader.
|
When determining which Query mode is appropriate for your custom report, consider the benefits and drawbacks of each.
- Direct Query can take more time than SPICE because it goes directly into the database; however, it ensures that you always have the most current data.
- SPICE saves time because you always have a snapshot of data available. You can efficiently create reports; however, the snapshot can be out of date. You can manually refresh the content before creating a report, or schedule regular updates to the snapshot the database content to ensure that the content is sufficiently recent.
To set a schedule for your SPICE dataset:
- On the Analytics Builder home page, click Datasets.
- From the Datasets list, select the dataset you want to refresh.
- Click Refresh. The Summary tab appears by default.
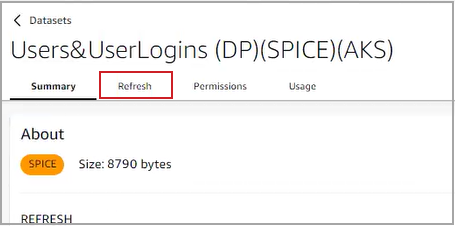
- In the top right, click Add New Schedule.
- In the Create a refresh schedule dialog, set the Timezone, Start time, and Frequency.
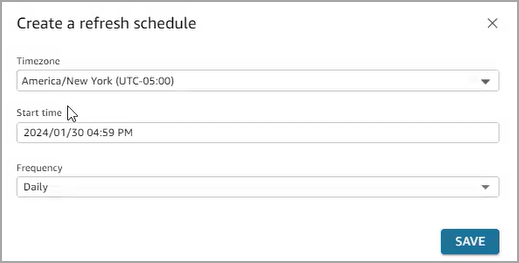
- Click Save.
To refresh your SPICE query mode
- On the Analytics Builder homepage, click Datasets.
- From the Datasets list, find and select the dataset you want to refresh.
- Click the Refresh tab.
- Click Refresh Now.
Video: Create a customized dataset using an existing data source in Analytics Builder
Create an analysis in Analytics Builder
Watch this video to learn how to create an analysis in Analytics Builder. Review the written steps below.
You can create a new analysis for your dataset assets (Brightspace Data Sets or custom datasets) using the Analysis area of Analytics Builder. The area acts as a private dashboard that is not shared with any other user. You can create one or more sheets, adding database fields or calculated fields to create visuals that are appropriate to your analysis needs.
To create a new analysis
- Navigate to the Insights Portal.
- Click the Analytics Builder option.
The Analytics Builder opens in the Analysis tab by default. From this view you can also see the Favorites, Recent, My Folder, Shared Folders, Dashboards, and Datasets tabs.
- Click the Datasets tab to show the list of available assets.
- Click the asset you want to use. You can scroll through the list or use the search bar to find the desired asset.
- Click Use in Analysis. The Analysis area displays.
- If you require more than one sheet in your analysis, click the + icon beside the Sheet 1 tab to add additional sheets.
- If the Visuals area is not already visible, click the Add Visual icon to display the menu of visuals.
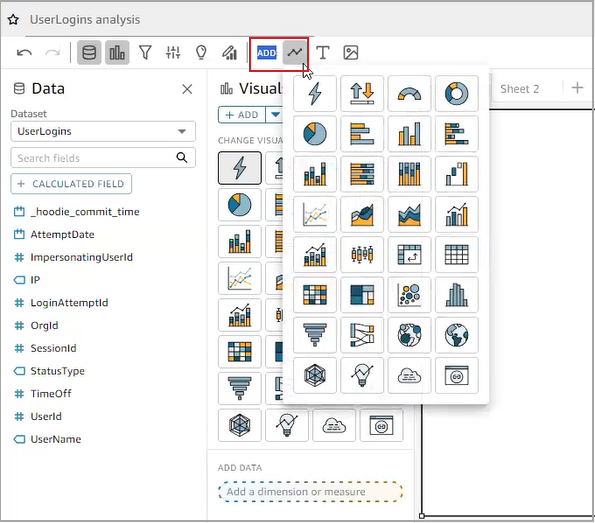
- Select the Visual you want to use. The menu changes to display the visual type and prompt you to add the necessary properties.
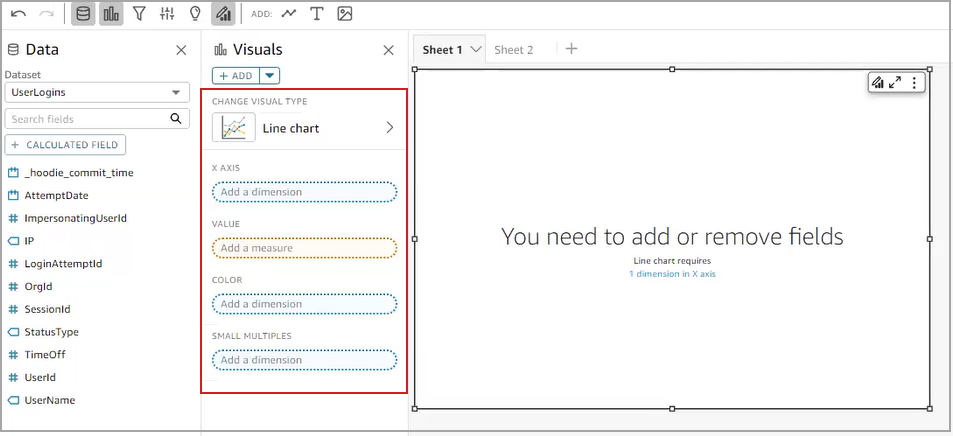
Figure: In this example, the user has selected the Line Chart visual type, and is prompted to complete the properties for the chart.
- From the Data area, drag and drop the data fields into the visual properties fields.
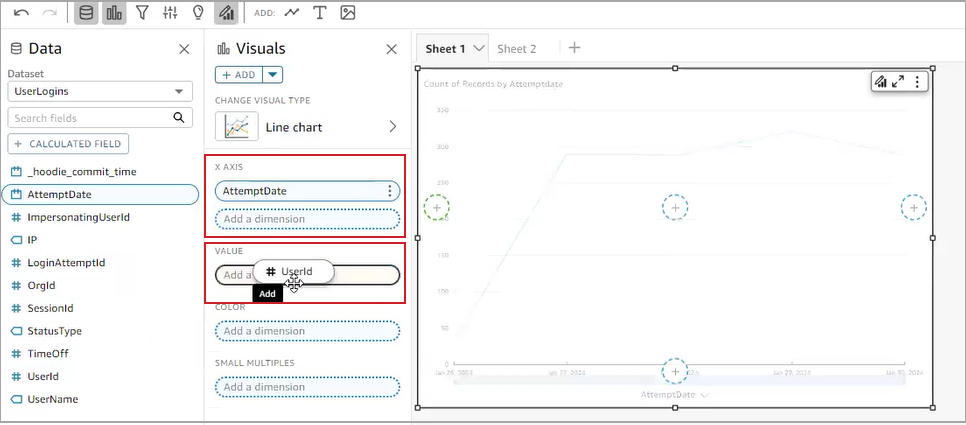
Figure: In this example, the report author has dragged the AttemptDate field into the X AXIS property and is in the process of dragging the UserId field to the Value property field. The sheet automatically draws the visualization based on the properties you have set.
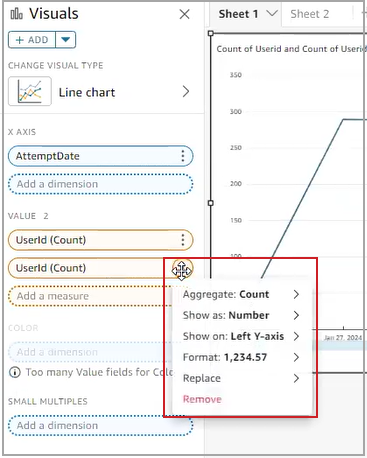
- If appropriate, click the More Actions (three vertical dots) menu to further define the elements of your visual.
Note: The additional configuration options differ depending on the context and field type.
- When your visual displays as desired, click Publish.
Drill down in a visual in Analytics Builder
Watch this video to learn how to drill down to view data at different levels of the field hierarchy in Analytics Builder.
Create a dashboard in Analytics Builder
Watch this video to learn how to create a dashboard in Analytics Builder.
Resolving assets impacted by BDS version changes
When the Brightspace Data Sets (BDS) version updates, Analytics Builder automatically loads the new version as part of its data refresh process. Major version updates occur roughly once a year and often include breaking changes. Minor Version updates occur every month and don’t introduce breaking changes, but they may still result in outdated or confusing data. When a BDS version change impacts your custom assets (datasets, analyses, and dashboards), the data refresh for those assets pauses and you must take steps to manually review and resolve them. This ensures you always have access to the most up-to-date and reliable data in Analytics Builder.
To resolve your impacted assets:
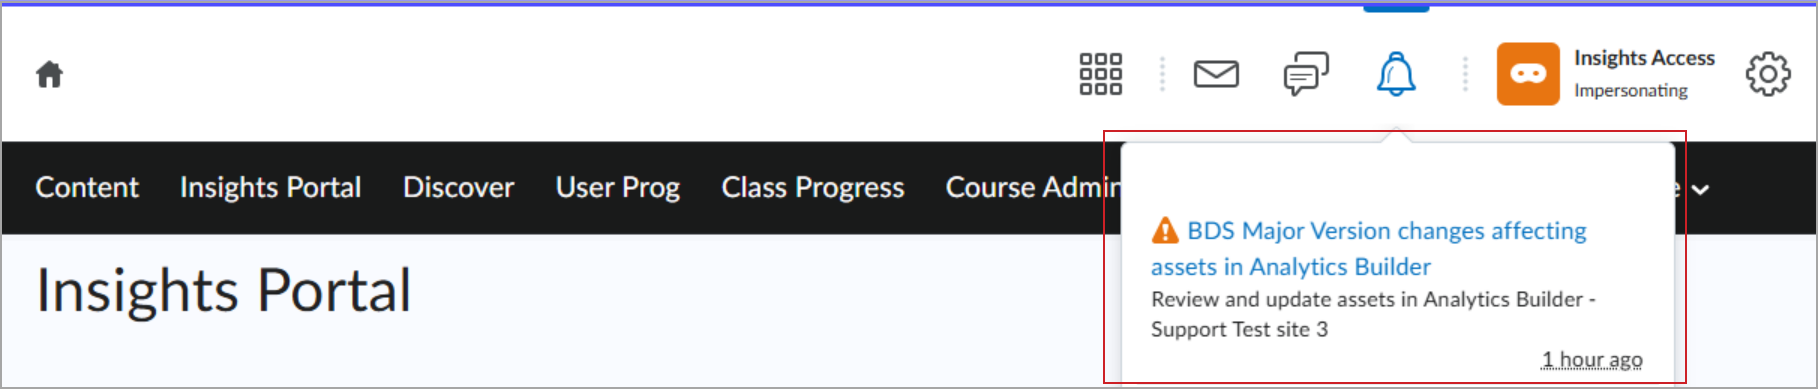
- Check your Brightspace notifications. If a BDS version change impacts your assets, you will see a notification that links to documentation on the steps to be taken.
- Navigate to Analytics Builder.
- Go to Shared Folders and open Assets to review. This folder contains subfolders for each BDS with changes that impact your assets.
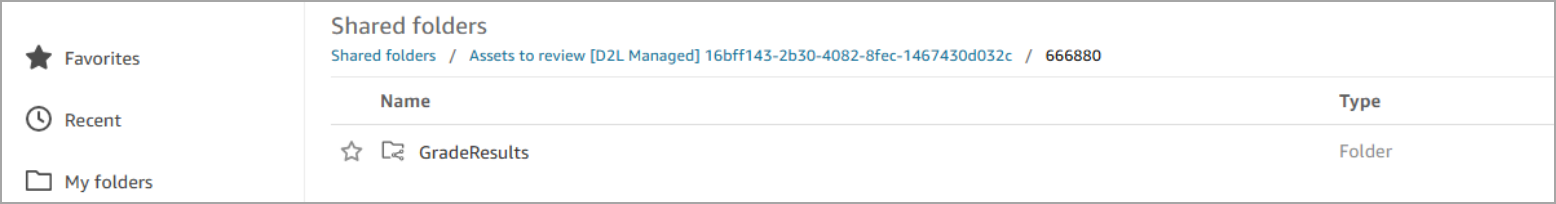
- Open each BDS folder to review the lists of impacted datasets and analyses that need to be updated.

- Edit your impacted assets. The edits you must make depend on the type of changes in the BDS version update. For example, if a column was removed from the BDS, you must modify your dataset to handle the column removal.
- Republish your fixed assets.
The data refresh process checks the items in the Assets to review folder every 24 hours. Resolved assets are removed from the folder and resume refreshing automatically, while unresolved assets remain paused. Once all impacted items are fixed, the Assets to review folder no longer appears.
|
Note: If an asset is impacted by more than one breaking change, the asset is listed in all the relevant BDS folders. |
