Brightspace Insights, built on the Brightspace Data Platform, includes easy-to-use reporting visualizations that provide a complete picture of users across Brightspace. This allows administrators, advisers, school leaders, instructors, and many more the ability to track, measure, and monitor learner progress and help improve adoption and engagement during their learning journey.
The Insights Dashboards are available in all languages and are fully accessible for those using assistive technology such as a screen reader or keyboard navigation.
Access Insights Dashboards
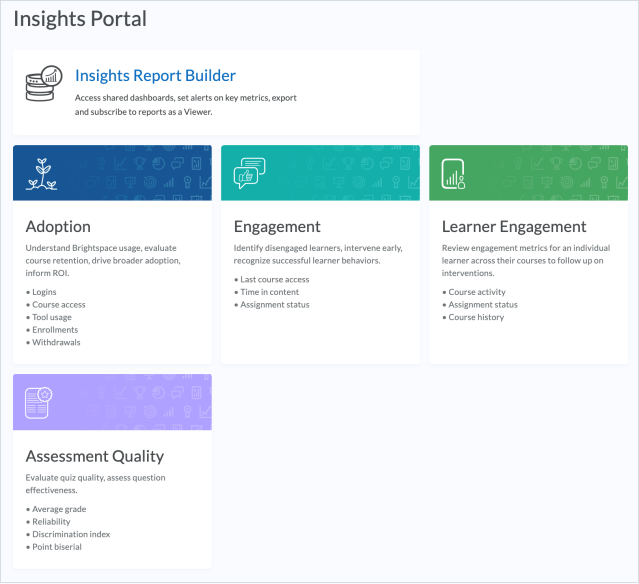
To access any of the cross-course dashboards:
- From the navbar, click Insights Portal.
- Click to select the dashboard you want to view.

Figure: Insights Portal with cards for accessing Insights Report Builder, Adoption, Engagement, Assessment Quality, and Learner Engagement dashboards.
About Roles and Permissions for Insights Dashboards
Roles that are granted permission to see a dashboard see data for each org unit in which they are enrolled with dashboard permissions unless otherwise specified in the details for the dashboard cards. In some cases, aggregated data at a higher level appears for all users. When a user attempts to drill deeper into the data, only data for the org units or users for which they have permissions appears on the dashboard.