You can create a new analysis for your dataset assets (Brightspace Datasets or custom datasets) using the Analysis area of Analytics Builder. The area acts as a private dashboard that is not shared with any other user. You can create one or more sheets, adding database fields or calculated fields to create visuals that are appropriate to your analysis needs.
To create a new analysis
- Navigate to the Insights Portal.
- Click the Analytics Builder option.
Figure: Click Analytics Builder. When Insights Report Builder reaches the end-of-life milestone at the end of 2024, only the Analytics Builder option will appear. The Analytics Builder opens in the Analysis tab by default. From this view you can also see the Favorites, Recent, My Folder, Shared Folders, Dashboards, and Datasets tabs.
- Click the Datasets tab to show the list of available assets.
Figure: The Datasets tab displays existing Brightspace Datasets and other assets you can use to create your custom report.
- Click the asset you want to use. You can scroll through the list or use the search bar to find the desired asset.
- Click Use in Analysis. The Analysis area displays.
- If you require more than one sheet in your analysis, click the + icon beside the Sheet 1 tab to add additional sheets.
- If the Visuals area is not already visible, click the Add Visual icon to display the menu of visuals.
Figure: The Add Visuals menu allows you to select a visual type for your analysis.
- Select the Visual you want to use. The menu changes to display the visual type and prompt you to add the necessary properties.
Figure: In this example, the user has selected the Line Chart visual type, and is prompted to complete the properties for the chart.
- From the Data area, drag and drop the data fields into the visual properties fields.
Figure: In this example, the report author has dragged the AttemptDate field into the X AXIS property and is in the process of dragging the UserId field to the Value property field. The sheet automatically draws the visualization based on the properties you have set.
- If appropriate, click the More Actions (three vertical dots) menu to further define the elements of your visual.
Note: The additional configuration options differ depending on the context and field type.
Figure: The More Actions menu enables you to further define the values on your visual.
- When your visual displays as desired, click Publish.
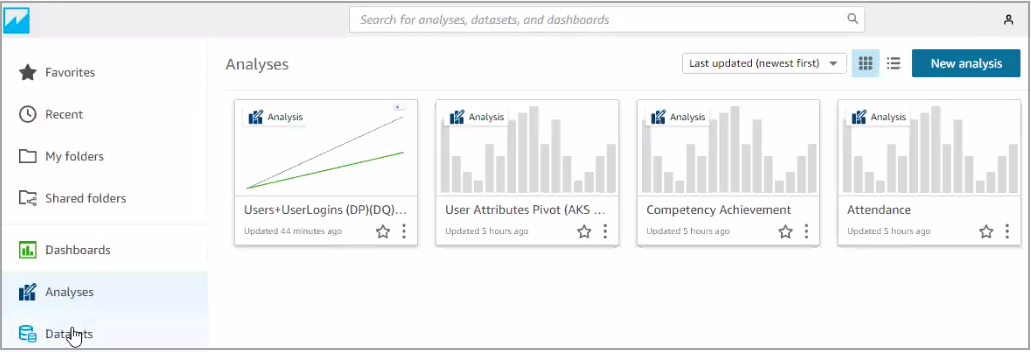
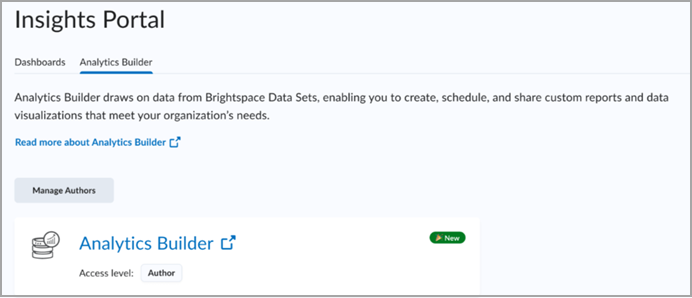
Using Visualizations in Analytics Builder
To see visualizations of existing analyses
- Navigate to the Insights Portal.
- Under Custom Reports, click the Analytics Builder option.
Figure: Click Analytics Builder. When Insights Report Builder reaches the end-of-life milestone at the end of 2024, only the Analytics Builder option will appear.
- From Analyses tab, select one of the thumbnail tiles to open the Analysis.
Figure: The Analyses tab displays previously created Analysis sheets.
Video: Create a visual in Analytics Builder
Video: Create a dashboard in Analytics Builder