Analytics Builder empowers users to explore and visualize their Brightspace data effortlessly. With built-in data pipeline management, you can focus on gaining insights rather than handling data complexity. It enables you to analyze key learning metrics and create custom visualizations without worrying about version control or managing differential and full data set extracts, ensuring you always have access to the most up-to-date and reliable data.
Users can launch Analytics Builder directly from the Insights Portal to access report authoring or viewing based on their permissions.
Key capabilities of Analytics Builder
Analytics Builder allows you to perform the following core tasks:
- Start with a template analysis and customize it to fit your needs
- Create new custom datasets and analyses
- Publish analyses with visualizations as dashboards to share with other users
- Access fresh Brightspace Data Sets (BDS) data that is ready for visualization
- Schedule reports to be refreshed and emailed to a group of stakeholders
- Leverage row- and column-level permissions
Analytics Builder provides users with a curated version of Amazon QuickSight, allowing them to create custom datasets, analyses, and dashboards with Brightspace Data Sets and selected external data sources. Not all features of Amazon QuickSight are available to Analytics Builder users since this version is managed by D2L.
Analytics Builder data
Analytics Builder primarily contains Brightspace Data Sets (BDS) from Data Hub.
The BDS in Analytics Builder follow the same d2l.Tools.BrightspaceDataSets.Version configuration variable setting as Data Hub. The version used is appended to the name of each dataset.
For information about managing BDS major version changes, refer to Updating Analytics Builder for Brightspace Data Sets Major Versions in Brightspace Community.
For most customers, the BDS refresh schedule is once a week for full data sets, and once a day for differential data sets.
After the scheduled BDS run, Analytics Builder checks to see if new data has been generated and loads any new data from Data Hub. Depending on the size of the update, this could take up to 2 hours to refresh data in Analytics Builder.
Analytics Builder also allows users to upload additional data from certain external sources. Authors can use both Brightspace Data Sets and external data to build custom datasets, analyses and dashboards.

|
Note: The ability to upload data from external sources is not automatically enabled. Contact your D2L Client Sales Executive or Account Manager for more information. Users must agree to updated Terms and Conditions before using this feature. |
For information on using external data sources refer to Import data from external data sources into Analytics Builder.
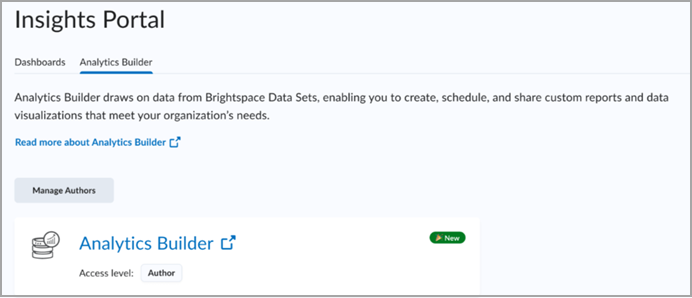
Access the Analytics Builder homepage
- Navigate to Insights Portal.
- Under the Analytics Builder tab, click Analytics Builder.
- Analytics Builder opens in the Analysis tab by default. From this view you can also see the Favorites, Recent, My Folder, Shared Folders, Dashboards, and Datasets tabs.
Video: Accessing the Analytics Builder homepage