To provide easier access to analytics about learners and courses, instructors can add the Course Overview widget to a course homepage. The Course Overview widget is available to Brightspace Performance+ clients. To learn more about Brightspace Performance+, contact your D2L Client Sales Executive. Refer to Set up Course Overview and Class Engagement for setup instructions for administrators.
Add the Course Overview widget
Instructors can modify their course homepage to include the Course Overview widget.
To add the Course Overview widget to a course homepage
- From a course homepage in Brightspace, click More Options (...) in the bottom-right corner and select Edit this homepage.
- In the Widgets section, click Add Widgets in the panel where you want to put the widget.
- In the Add Widgets dialog, select Course Overview and click Add.
- You can optionally click and drag the Course Overview tile to move it to the desired position.
- Click Save and Close.
About the Course Overview widget
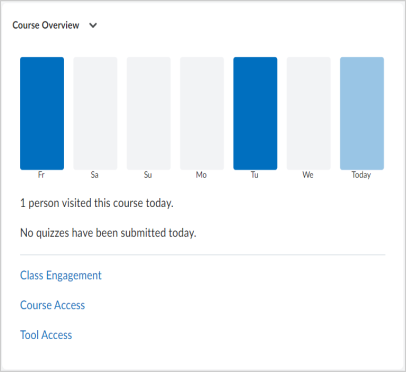
The widget displays a visualization of weekly course access (the Course Access report as a bar chart) and how many learners submitted quizzes today. In addition, the widget includes links to the Class Engagement tool, Course Access report, and Tool Access report.

Figure: The Course Overview widget displays high-level aggregate information about the course and links to course-specific Brightspace Insights reports.
Course Access report
This is a course-specific Brightspace Insights report designed to help you better understand user engagement in a course. You can export the report data for further analysis in third-party tools.

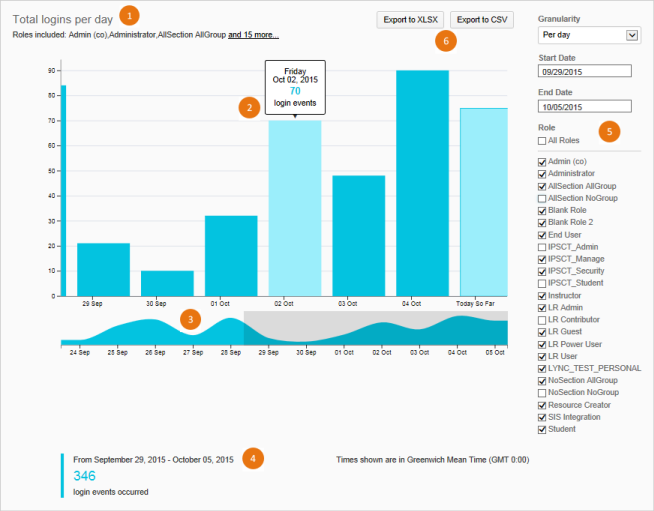
Figure: Visual tour of the Course Access report.
- Title: Describes the data in the report. If role filtering is enabled, a subtitle displays the roles included in the report.
- Tooltips: Hovering over a chart element displays more details about the date and number of accesses.
- Sparkline: This provides context for the bar chart by showing a larger date range.
- Click and drag either edge of the shaded section in the sparkline to modify the date range for the report. This has the same effect as manually modifying the date range in the Filters column.
Summary: Displays the current date range and total number of accesses.
Filters: Use these to dynamically filter the report by date and role.
- The Role filter allows you to filter report data by a specific role, multiple roles, or all roles. For example, you can see how many learners log in to Brightspace during a specific date range and what tools they interact with. By default, all roles are selected when you first open the report. If a role appears in the filter, that indicates that there is at least one user with that role in the org unit of the report you are viewing. You cannot customize which roles display in the Role filter.
Export options:
- Export to XLSX: Saves the report as an XLSX file to open in Microsoft® Excel®. In the XLSX file, the Dataset sheet displays the data used to generate the report and the Report sheet displays the report visualization.
- Export to CSV: Saves the report as a CSV (comma separated values) file so that it can be read by any text editor. You can also import the file to other tools or open it in Excel.
- When you export a report, it only includes data that matches the current filters.
Tool Access report
This is a course-specific Brightspace Insights report designed to help you better understand user engagement with course tools. You can export the report data for further analysis in third-party tools.
Any page that is configured in the software to generate a UserInteractionEvent counts as a page view. When a user browses from page to page within a tool, such as Discussions, Quizzes, or Content, each page counts as an additional page view event.

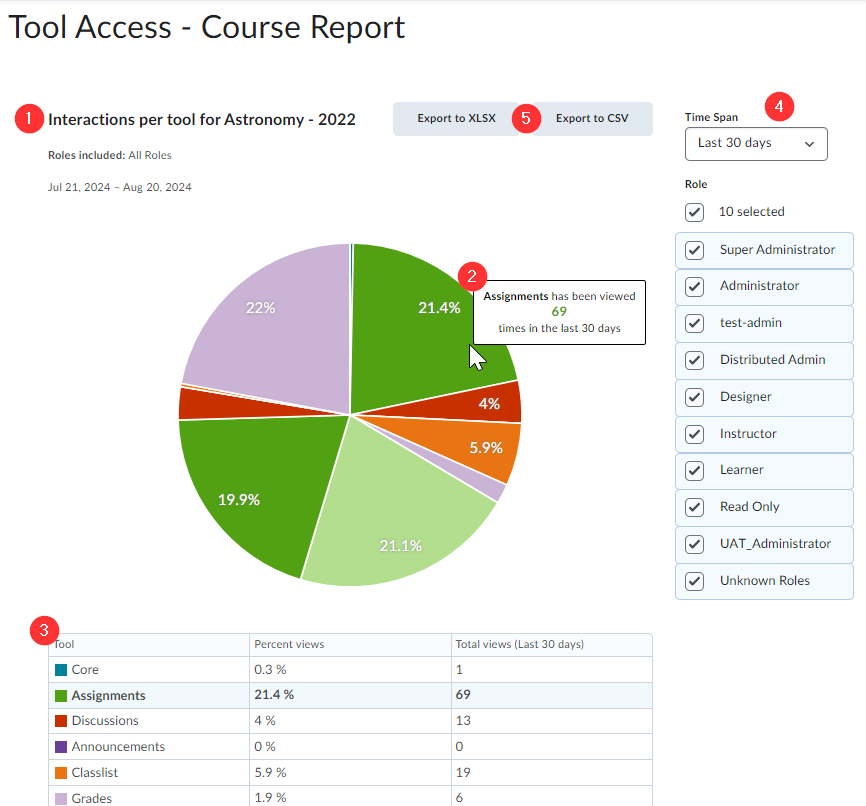
Figure: Visual tour of the Tool Access report, with the Time Span filter set to Last 30 days and all Roles selected.
- Title: Describes the data in the report. Subtitles describe the roles included and the dates included in the report.
- Tooltips: Hovering over a pie segment displays more detail about the number of accesses.
- Table: Tabular data appears below the pie chart for data transparency and accessibility. It also functions as a legend for the colors of the pie segments.
- Filters: Use these to dynamically filter the report by date and role.
- The Time Span filter allows you to filter the Tool Access report by the last 7 days, 30 days, or 12 months. By default, the report displays the last 7 days.
- The Role filter allows you to filter report data by a specific role, multiple roles, or all roles. For example, you can see how many learners log in to Brightspace during a specific date range and what tools they interact with. By default, all roles are selected when you first open the report. If a role appears in the filter, that indicates that there is at least one user with that role in the org unit of the report you are viewing. You cannot customize which roles display in the Role filter.
- Export options:
- Export to XLSX: Saves the report as an XLSX file to open in Microsoft® Excel®. In the XLSX file, the Dataset sheet displays the data used to generate the report and the Report sheet displays the report visualization.
- Export to CSV: Saves the report as a CSV (comma separated values) file so that it can be read by any text editor. You can also import the file to other tools or open it in Excel.
- When you export a report, it only includes data that matches the current filters.

|
Note: The Core tool in the Tool Access report refers to the Course Admin screen. |
Troubleshooting Course Overview reports
Filtering a report by date is designed to report on a specified date range; however, if the last 7 days in the date range do not contain data, the report displays data based on the earliest day containing data. For example, if you run a report on June 1, 2019 and the earliest date containing data is May 7, 2019, the report displays data from May 1, 2019 to May 7, 2019.