You can review statistics related to attempts and completion of Quizzes in Brightspace.
View and filter quiz statistics
You can view and export quiz statistics and reports to a CSV file or an Excel file for data analysis. Exports of quiz statistics contain all pertinent information on the quiz so that you can query, sort, and evaluate the data without being connected to Brightspace. In this view, you can see a list of quizzes for the course. The average grade for each quiz displays beside the quiz name.

|
Important: Quiz statistics are no longer accurate if you edit a question in the quiz after the quiz question has been attempted by a student.
|
To view and filter quiz statistics
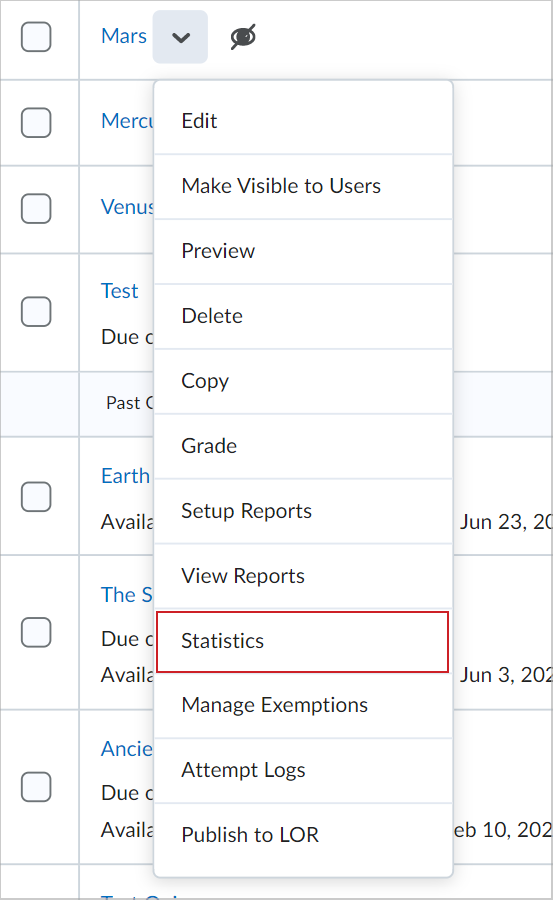
- On the Manage Quizzes page, open the Actions drop-down menu for the quiz you want to view and click Statistics.
- On the View Statistics page, click the User Stats, Question Stats, and Question Details tabs to view statistics organized by user and by question.
- If you need to focus your analysis on specific sections or groups, you can use filters by Groups and Sections. The filters apply to User Stats, Question Stats, and Question Details tabs.
Question Statistics displays updated values to account for point deductions, including a below-zero average score.
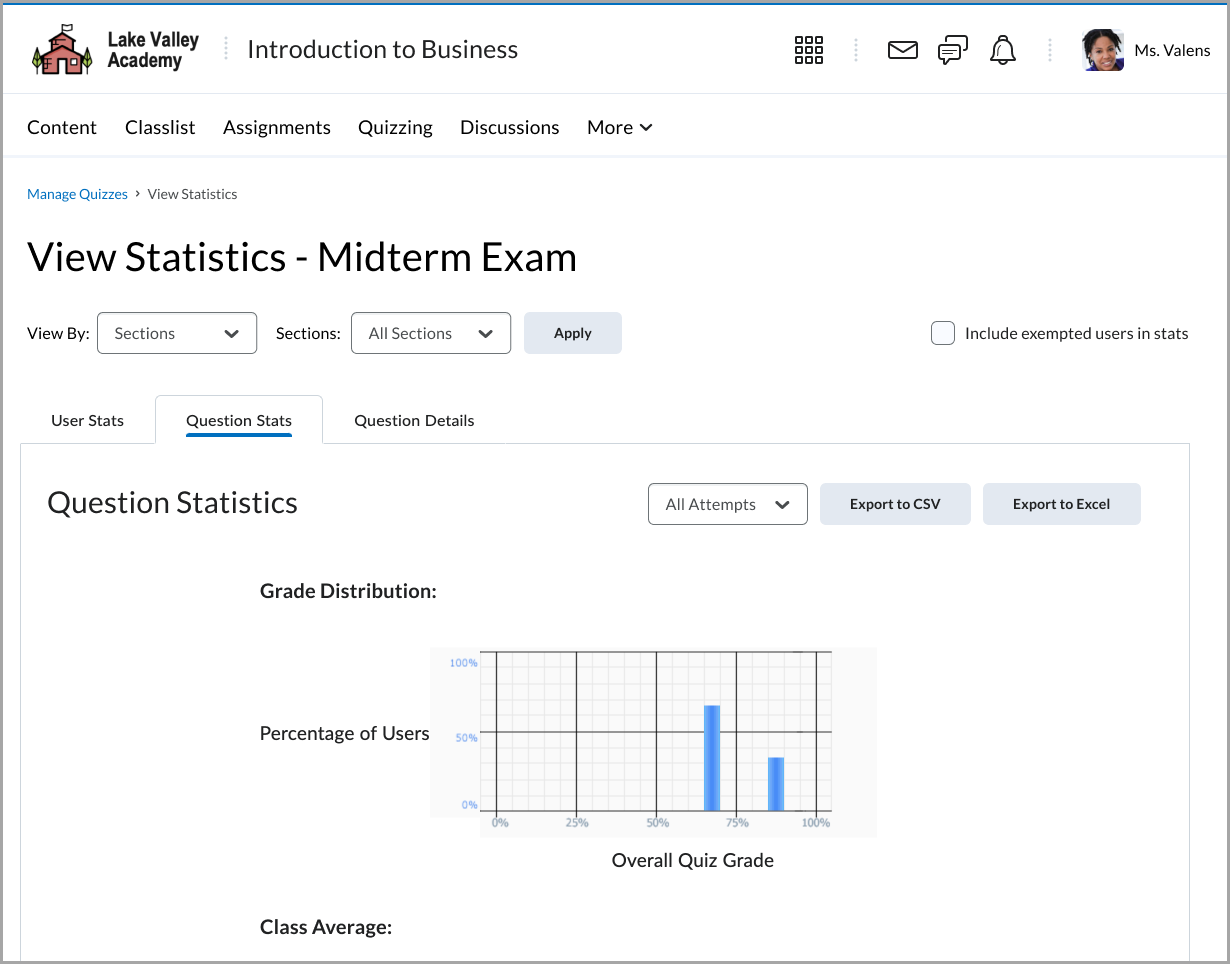
Additionally, on the Quiz Stats and Question Details tabs, you can view all attempts or filter to show only the first attempts.
 | Note: If a quiz contains zero-point questions, they are not included in the Grade Distribution and Average Question Grades charts. However, they still appear in the table of questions with a link to open the question preview. All related fields, including Average Grade, display “N/A.” |
- Click Export to CSV or Export to Excel if you want to save the quiz's statistics to your computer.
|
Note: The system exports the statistics only from the tab you are currently viewing. |
Understanding User Stats
User Stats CSV and Excel files contain performance data by user, including the user’s Org Defined ID, username, first name, last name, quiz score, the value the quiz was graded out of, the user’s score as a percentage, and the class average.

|
Tip: You can create a column to calculate the median score on the quiz to consider the class’s performance from a different perspective. Use the formula <=median(x1:x5)> to calculate the median. |
Understanding Question Stats
Question Stats CSV and Excel files contain data about the average score on questions by points and percentage.
The question title, text, bonus status, and difficulty level are included in the files so that data can be analyzed without referring to the learning management system.
|
Tip: You can sort, query, hide, and delete data to help your analysis and create charts or graphs to visually represent trends. |
|
Note: Quiz statistics are not computed for questions in a Question Pool. |
Understanding Question Details
Question Details CSV and Excel files contain detailed information about each question in the quiz, including a list of all of the answers provided for each quiz attempt, how many users chose each possible answer, the total number of responses, and the average score on the question. Question Details reports can help you evaluate trends in answers and look for questions that were unclear or difficult for a number of users.
The question title, text, bonus status, and difficulty level are included in the CSV file so that data can be analyzed without referring back to the learning management system.
|
Tip: You can create a column that calculates the average score for all question attempts as a percentage by dividing the Average Score column by the Out Of column and multiplying by 100. Next, create a custom filter for the new Attempt Average column that displays only rows where the attempt average is less than 51%. This way you can quickly review questions that users struggle with and adjust grades or your lesson plans accordingly. |
Data exported for question details
Question Type
|
What is exported
|
| Multiple Choice |
All possible answers and the number of responses for each answer. |
| True/False |
All possible answers and the number of responses for each answer. |
| Written Response |
All the responses provided listed on separate rows. |
| Short Answer |
The correct answer for each blank and an additional row for all other answers, and the number of responses for the correct answer versus other answers. |
| Multi-Short Answer |
The correct answers for each blank and an additional row for all other answers, and the number of responses for the correct answer versus other answers. |
| Fill in the Blanks |
The correct answers and an additional row for other answers, and the number of responses for the correct answer versus other answers. |
| Multi-Select |
All possible answers and the number of responses for each answer. |
| Matching |
All possible matches and the number of responses for each match. |
| Ordering |
All answers in the order match and the number of responses for each match. |
| Arithmetic |
Questions are broken down by results and units. Also, lists which users had both results and units correct, only results correct, only units correct, and neither correct. |
| Significant Figures |
Questions are broken down by results and units. Also lists which users had both results and units correct, both results and units correct, as well as significant figures, only results correct, only results and significant figures correct, only units correct, and neither results or units correct. |
View quiz Attempt Logs
Attempt Logs track detailed quiz attempt events per user. From the Overview tab you can view quiz attempts based on Quiz Entry time, Quiz Completion time, Quiz Attempt Deleted, and Quiz Attempt Restored.
From the Detailed tab you can view the following quiz attempt events: Quiz Entry and re-entry times, Response Save time, Page Movement time, Quiz confirmation screen and completion time, auto submission for auto-submitted quizzes, and IP Address when each event occurs.
|
Note: If a learner loses internet connectivity during a quiz attempt, Brightspace does not log the moment the connection is lost because no server communication occurs while the learner is offline.
Once the learner’s connection is restored, the system logs activity again. Multiple responses may appear with the same timestamp once the connection is restored. |
To view Attempt Logs for quizzes
- Navigate to Quizzes.
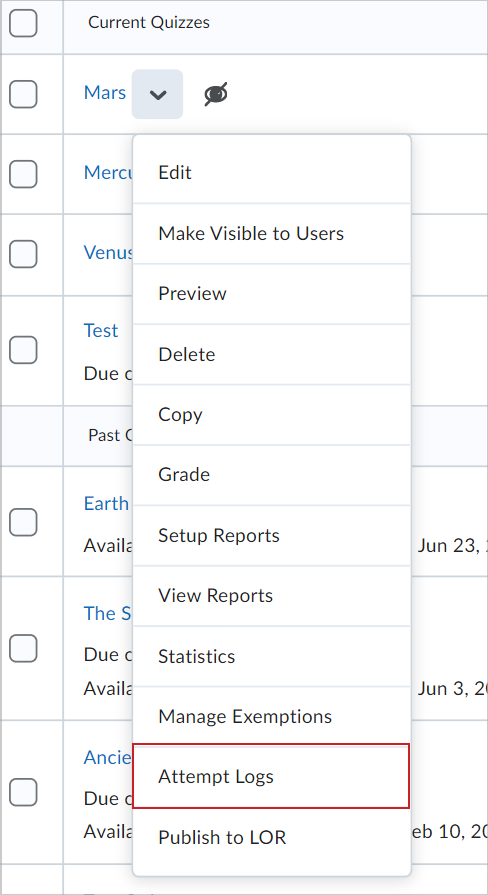
- On the Manage Quizzes page, from the Actions drop-down menu, click Attempt Logs.
- On the Attempt Logs page, from the Overview tab to filter your view of the attempts by the following filters:
- Quiz Entry: View quiz attempts that have been started by learners.
- Quiz Completion: View quiz attempts that have been completed.
- Quiz Attempt Deleted: View quiz attempts that have been deleted.
- Quiz Attempt Restored: View previously deleted quiz attempts that have been restored.
All selected filters display their associated results. To deselect a filter, click the filter label again.
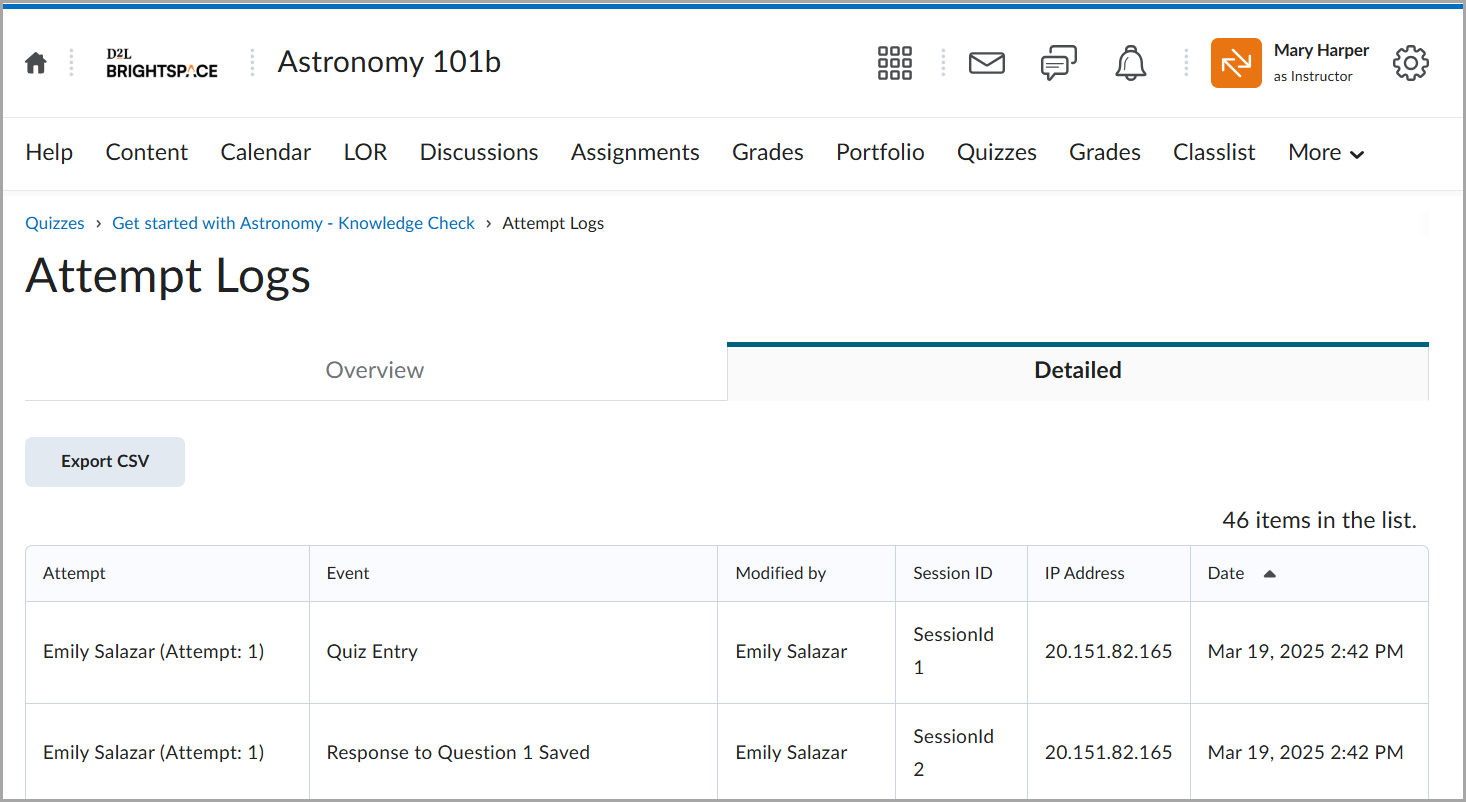
- Click the Detailed tab to view all Attempt events for the quiz.
Each attempt has the name of the user who performed the Event. For each attempt, the event is described, Modified by notes who performed the event, and Date states when the Event took place.
Use the Session ID column to identify when learners have multiple sessions within a quiz attempt, along with the IP Address column to identify when learners have changing IP Addresses during a quiz attempt.
| Note: Additionally, an Export CSV option is available to allow you to export the data and analyze it further. |
Restore deleted quiz attempts in the Attempt Logs
You can restore deleted quiz attempts for students in the quiz's Attempt Logs Overview tab.
|
Important: A deleted quiz attempt can only be restored if the student does not have another quiz attempt in progress. The Restore button only appears for the latest deleted quiz attempt.
|
To restore a deleted quiz attempt
- Navigate to Quizzes.
- On the Manage Quizzes page, from the context menu of the quiz with attempts you want to reset, click Attempt Logs.
- From the Overview tab, click Quiz Attempt Deleted. Click Restore for the quiz attempt you want to restore.
Video: Restore a Quiz Attempt