This article describes the D2L Status Page, which provides a dashboard with the up-to-date status of your Brightspace sites and other D2L services you use.
Viewing the D2L Service Status page
The D2L Service Status page provides a visual indicator of the status of your D2L services. The status changes when the D2L Cloud Operations Reliability Engineering team determines that a service disruption has occurred, and subsequently sends out a D2L Impacting Event Notification email to the affected customers' Approved Support Contacts (ASC). After the email is sent the D2L Status page is automatically updated with the same information from that email.

|
Note:The D2L Service Status page does not function as a direct uptime monitor; there may be a short delay before the page is updated with a new service disruption. |
When all services are available, the site indicates with messaging that reads All Services Operational.
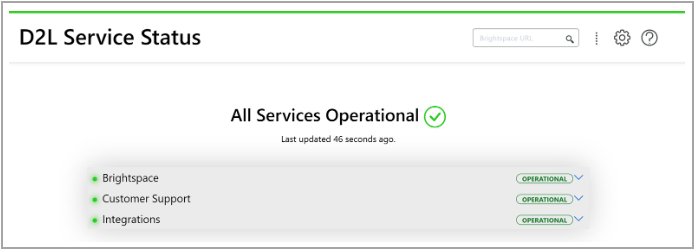
Figure: The site indicates All Services Operational when all services are available.
If there is an impact to services, the site indicates the disruption with messaging that reads Service Disruptions.
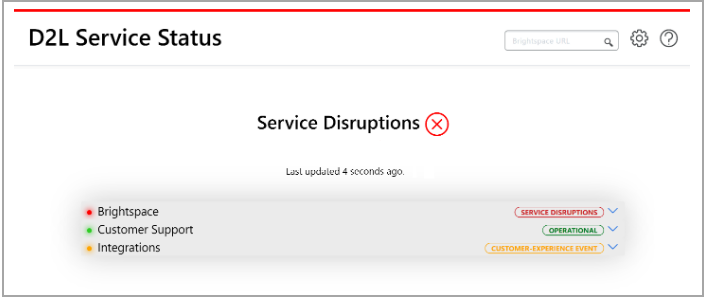
Figure: The site indicates Service Disruptions when there is an impact to some services.
Expand each of the service categories for your page to see their components.
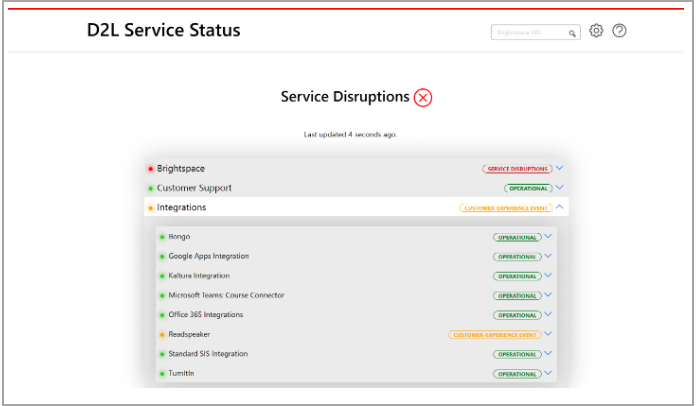
Figure: Expand a service category to view its components.
Viewing outages that affect a particular URL
You might not be affected by every service disruption that occurs. To be certain, you can enter your main Brightspace URL in the search bar of the Service Status page to learn if you are affected by any disruptions.
Note: On the status page, you can only view disruptions for the primary URL for each production org. ASCs for the orgs receive an email for disruptions to a non-production org.
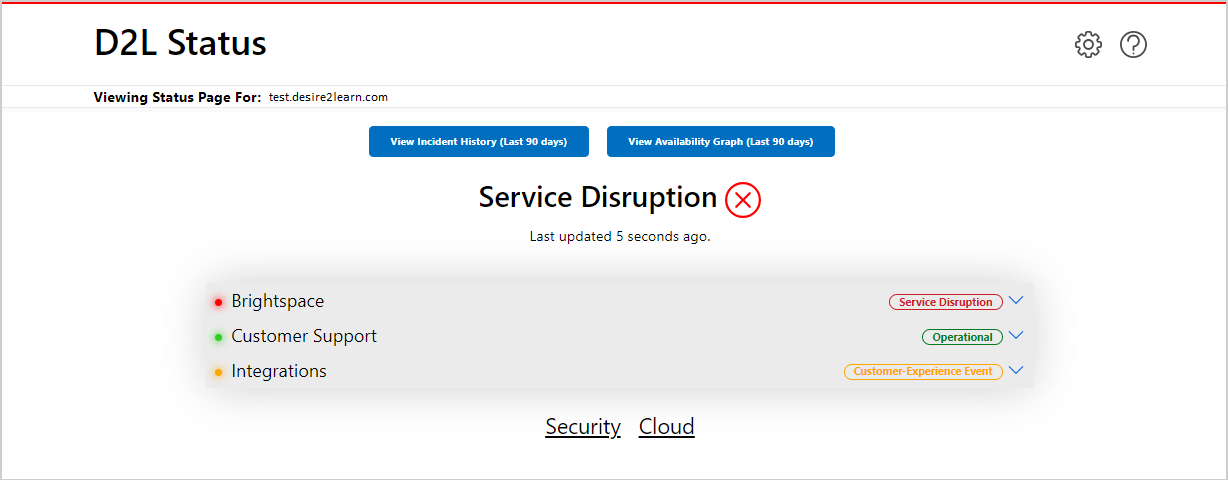
Figure: View potential service disruptions by entering your Brightspace URL.
The URL for the D2L Service Status page changes to reflect your particular site. You can share this link to direct users to view the Service Status for your implementation of Brightspace and to check if any service disruption is occurring.
Viewing historical outages affecting a particular URL
On the D2L Service Status page for a Brightspace implementation, you can click View Availability Graphs to display the overall availability of critical functionality for your Brightspace instance.
There are two graphs on this page: the first shows the percentage of each day that your site was available for each of the last 90 days; and the second shows the percentage of each month that your site was available for each of the last 4 months (including the current month).
You can click Need Older Data? to be linked to the community where you can request additional historical information if required.
Note: These graphs show the overall availability of your Brightspace site. There may be notifications about impact that you can see in the Incident History (Last 90 Days) view that are not present in these graphs as they did not affect the overall availability of Brightspace.
 Figure: Use the 90-day graph to see the percentage of each day your site was available.
 Figure: Use the 4-month graph to see the percentage of each month your site was available.
On the D2L Service Status page for a Brightspace implementation, you can click the View Incident History to display any events that you have been notified about in the last 90 days. If there have been no events, a pop-up message appears.

Figure: The History Error Message indicates there are no reported outages in the last 90 days.
If there has been one or more issues on your Brightspace primary site affected by a service outage in the last 90 days, an impact timeline offers a summary and updates on the event.
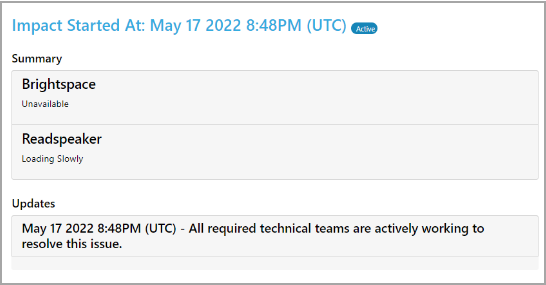
Figure: Use the impact timeline to view historical impacts, a summary for each service, and updates on any ongoing items.
Help and Options features on the Service Status page
The top right of the Service Status page contains the Option and Help icons:
- Click the Help icon for information about how to use the site.
- Click the Option icon to toggle Dark Mode on or off, and to enable or disable the Auto Refresh option to automatically refresh the site every minute if there are updates.
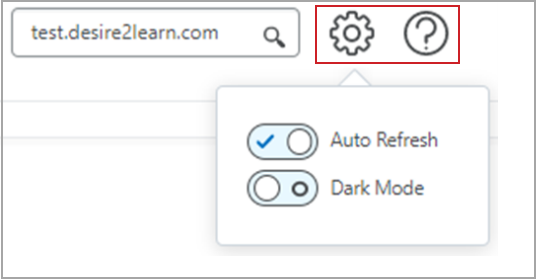
Figure: Click the Help icon for assistance with the Service Status page; or click the Option icon to alter the display and site refresh.