Creating a Report for college-wide absentee students

Hi there,
I'd like some advice or direction on how to handle an issue at my college. I have some staff members asking me if there is a way to create a college-wide report that lists all the students the didn't show up to their online classes after the first week (and list the classes the absentee students are in as well). I feel like there is a way to do this, but I've never created something like that, so I wanted to check if anyone else has a similar system.
Answers
-
@Dane.L.746 Hi Dane, you can get this data by joining the Course Access (logins via a browser), Course Access Log (logins via the Pulse app), Organizational Units (for course names), and Users (for student names) data sets.
-
@Jennifer.W.973 Jennifer.W.973
Thank you, Jennifer. Is there some documentation I could read so I could get more familiar with joining data sets?
-
@Dane.L.746 Will you be working in Analytics Builder or downloading files from Data Hub? Are you familiar with the concept of SQL joins? I mostly use SQL in Analytics Builder but you can also easily join tables on matching keys using the new data prep tool, which is usually easier for beginners. (Or if you're downloading files, you can use Power Query in Excel if you don't have a ton of data.) You'll need to check the data set documentation and look at the entity relationship diagrams to see which keys to join.
-
Hello, @Dane.L.746 , how are you?
Going a bit more in-depth, when we look at the data data in the CSV files from the Course Access data set, it looks like this example from my test website: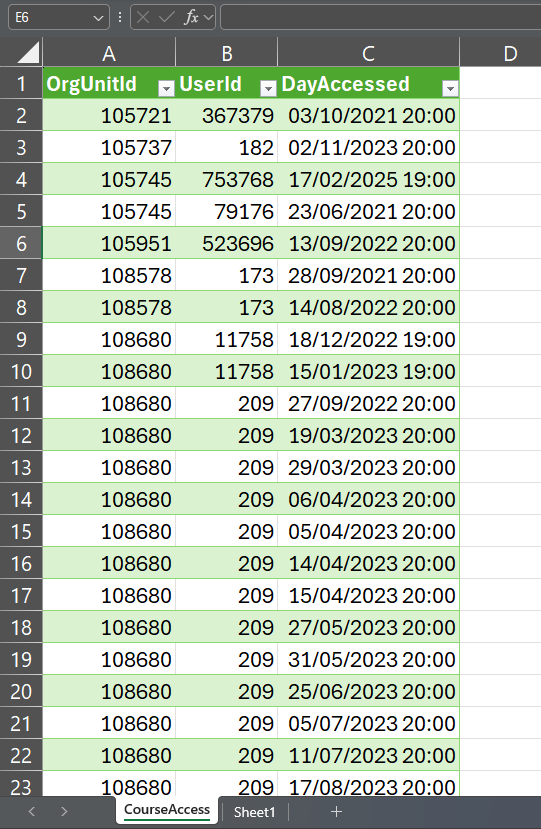
This, in a bit of a raw form, already has all the information we need. It shows all the Users (UserId column) who have visited all Course Offerings, and other organizational units, (OrgUnitId) and when that happened. By exclusion, and filtering by OrgUnitId and UserId, we can know which Users were absent. The same is valid for the Course Access Log, but that concerns visits made via the Pulse app.
In order for this data to be more informative, we can combine that dataset with the Organizational Units data set, which will reveal to us the name of the Course Offerings (instead of only showing us the OrgUnitId value). The same logic applies to the Users data set, which will reveal to us the name of the Learners (not only their UserId value).
The cross-referencing of the multiple data sets can be done externally to Brightspace, by downloading the CSV files and adding them to data visualization software (e.g. Microsoft Excel, via Power Query, Tableau or PowerBI). Or it can also be done inside of the platform, writing queries in the SQL language in the Analytics Builder.
I hope you have found this information to be useful. Should you have any questions or concerns, please, don't hesitate to let me know and I will be more than glad to further assist you.
Thank you kindly,
Piero de Sá
Bilingual Product Support Analyst -
Hi everyone, I brought your ideas to our Senior Systems Analyst, and we found this Domo dashboard made by a previous database manager who is no longer with us. It fits the filtering ideas brought up by others, and we can organize by last accessed as well. It only goes up to December of last year, but we are working on changing the time frame.
I want to thank everyone for their help and suggestions!


