We are excited to announce a major upgrade to Analytics Builder, a new Data Preparation experience that makes it easier and faster to prepare your data for dashboards and reports. This update introduces a visual interface that allows authors to build and organize multi-step data preparation workflows. Raw Brightspace Data Sets can be transformed and previewed - all within an intuitive interface. Additional data from external sources can be combined to create unified datasets for analysis.
A New Way to Create Custom Datasets
Current Data Preparation Experience
Previously, authors working in Analytics Builder created datasets by navigating through separate menus for each step in the process. This involved selecting fields, changing data types, adding calculated fields, joining tables, and incorporating data from various sources individually. Although this approach was functional, it presented challenges in visualizing the movement and transformation of data throughout each stage. As a result, understanding how data evolved across the workflow was often difficult and less intuitive.
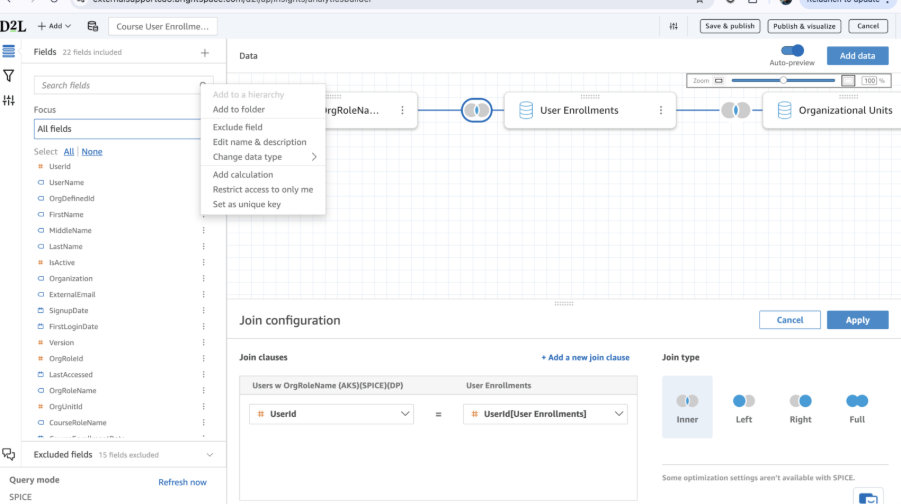
Figure: Current experience for building datasets using separate menus for fields, joins, and filters
New Data Preparation Experience
The new Data Preparation experience introduces a visual workflow instead of the traditional editing view. With this interface, users can view and interact with each transformation step, which facilitates dataset construction, troubleshooting, and management.
Actions such as adding data, modifying data types, renaming columns, appending, joining, aggregating, filtering, pivoting, or unpivoting are shown as connected steps within the workflow. This offers a transparent overview of the progression of data from its source to its output.
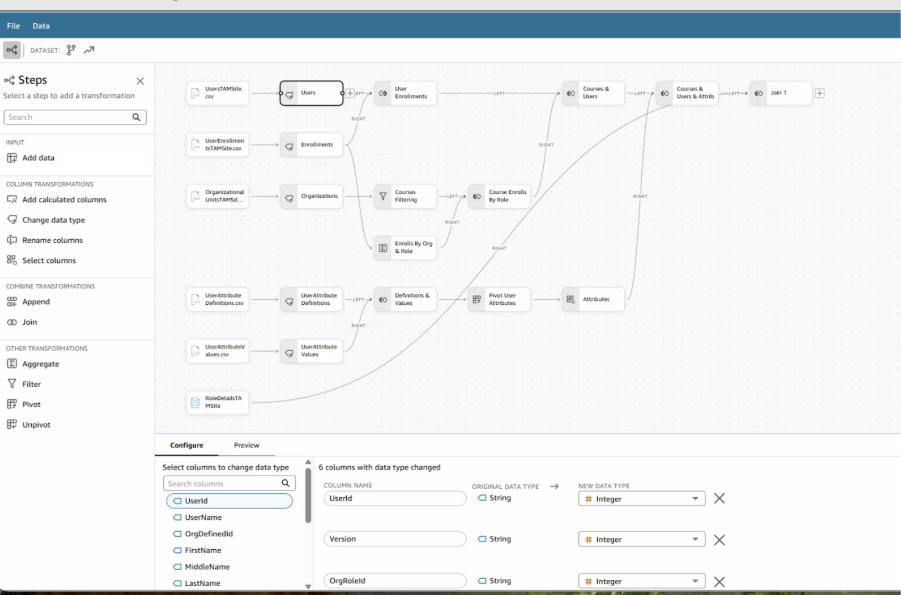
Figure: A visual workflow for building and managing datasets
What's New
- Visual Workflow: Build and organize data workflows with drag-and-drop simplicity.
- Data Previews: Show how each transformation changes your data in real time.
- Expanded Transformation Options: Perform transformations in the visual interface. Now you can:
- Aggregate your data with Sum, Average, Count, Count Distinct, Min, and Max functions.
- Union (All) to combine multiple data sources into one view.
- Pivot to rotate rows into columns for easier comparison.
- Unpivot to convert columns into rows for deeper analysis.
- SPICE-Optimized Performance: To ensure fast, reliable performance for large datasets, the new Data Preparation experience uses SPICE. Existing transformations remain supported in both SPICE and Direct Query modes, while new transformations Aggregate, Pivot, and Unpivot are available only in SPICE. This approach optimizes processing for complex operations that require more computing power, delivering a faster and smoother authoring experience.
How It Helps You
- Faster data preparation: No more jumping between screens or writing queries.
- Greater clarity: Understand every step in your data flow.
- More confidence: Preview results instantly to validate your work.
The Path Ahead
The new Data Preparation experience does not follow the Brightspace Wave Schedule and will be available between January 26 and January 30, 2026. The feature will be enabled gradually by region, so availability may vary depending on location.
- New custom datasets will, by default, open in the new Data Preparation experience with the option to switch to the current experience if needed.
- Existing custom datasets, analyses and dashboards will continue to function as they do today and will not be impacted.
- Both experiences will remain available until further notice.
- Recommendation: We encourage authors to begin exploring the new Data Preparation experience featuring visual workflow, data previews and expanded transformation such as Aggregate, Union, Pivot and Unpivot.
This release reflects our ongoing commitment to helping data-skilled teams unlock deeper insights. With Analytics Builder, your organization can turn data into insights faster, more easily and with greater confidence than ever before.
If you have any questions or would like to share feedback, please visit the Brightspace Community Group to connect with our team.