Accessing surveys and survey data

Hello
I want to create a survey to capture learner feedback on individual courses and testing using Surveys to do this.
I've created the survey on an individual course. When I go in as learner view, I cannot access it. I can see it via the nav bar survey icon, but cannot click. It is visible to learners
On a test, the data comes back as a spreadsheet of data in a list rather than the responses in a line (horizontal) by learner submission, as MS Forms would do. Is there a way to amend to get a better 'view'
also, is there a way to create a survey at org level to be pulled into courses rather than create at course level for every course.
thanks in advance!
Kate
Answers
-
Hi @kate.s.707
Is the course you're adding the survey to active?
I wonder if the survey can be accessed by the student tole you're viewing as becasue technically the course is not available to them?
When I navigate to the Survey Tool, and select the context menu next to the survey I'm interested in, there's an option called "Reports"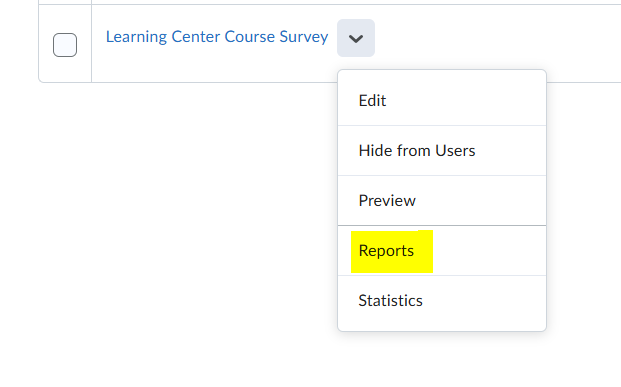
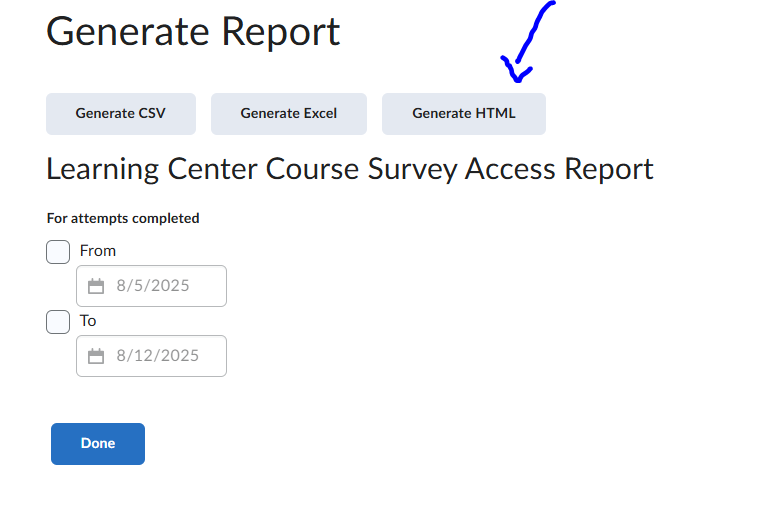
After selecting "Reports" and the hyperlink that follows on the next page to view the options for the report, I'm presented with options for formatting my report. One of the options is labelled "Generate HTML." That button sounds intimidating but the display is pretty nice.
Once I've selected "Generate HTML" I can see a report that summarizes the data by showing the number of users who responded to a question about their feelings on a specific course. In the screenshot following I can see that 1 person strongly disagrees with the statement that: this was an extremely valuable learning resource for me. That response is shown in a horizontal bar graph representing the total value of that response in responses received. In this example, since 1 person felt that way the red graph is small in comparison to the 7 responses that strongly agreed with the statement. Their agreement appears as a green bar in the graph. To the right of the coloured graph, I can see the number of users who responded to each option and the percentage of the total responses represented by that specific option.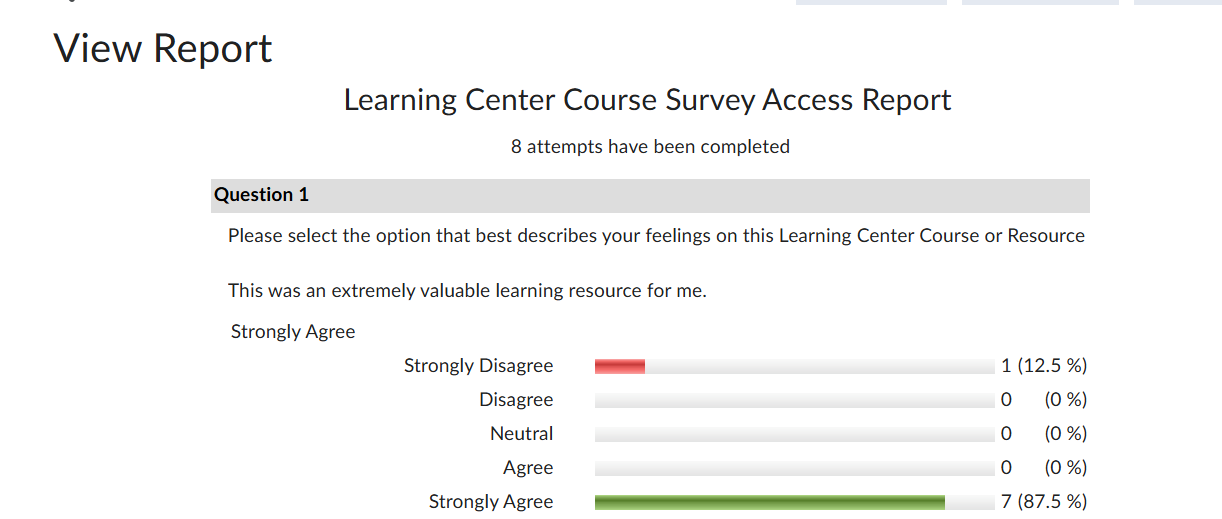
I'm not sure if there's a way you can share a survey from the org level directly- but I think you could copy an existing survey into your course using the Import/Export/Copy/Components Tool. That way you wouldn't have to recreate the survey each time.
Let me know if that helps to offer a way forward- grateful to you for offering your question here 😀
